BP shares set to ease as rivals report earnings
BP investors applauded its quarterly update on Tuesday as the UK’s No.2 oil major set a marker of just relative wins for similarly depleted rivals that […]
BP investors applauded its quarterly update on Tuesday as the UK’s No.2 oil major set a marker of just relative wins for similarly depleted rivals that […]
BP investors applauded its quarterly update on Tuesday as the UK’s No.2 oil major set a marker of just relative wins for similarly depleted rivals that will report over the next few days.
Close examination of absolute fundamentals left quite a bit less to cheer about, in our view.
On an underlying basis, BP’s $532m core result beat low expectations, and its share’s rise of as much as 5%, trimming the fall over a year to c.25%, was in keeping with an overall picture that remains uncertain, as oil prices show signs of topping out a 70% rally since January.
In anticipation of this kind of sentiment, BP announced potential deeper cuts to capital spending.
After trimming organic capex to $3.9bn from $4.5bn in Q1 2015, the group said it targeted $17bn in 2016 spending compared with $17bn-$19bn previously. A deeper cut to $15bn-$17bn is possible, the group said, if oil prices fail to recoup further.
Its lowered assessment of the price per barrel at which its operations would be sustainable—$50-$55 from $60 before—should be considered further ‘good news’ given constraining choices.
Place the cost scenario alongside BP’s downstream ops, which once again came to the rescue in Q1, with a $1.88bn profit, against a $747m loss from oil & gas production.
Downstream is set to be, once again, an important differentiator between rival majors when they present earnings this week.
Especially given that BP’s downstream income doubled against Q4, but was almost 10% lower than Q1 2015.
Elsewhere, investors also appeared to have shrugged off the group’s negative-looking net debt result. We think many may take a second look at it soon.
Figures from closely matched European and US giants Total, Statoil, Shell, Chevron and Exxon Mobil over the next several days could reveal more aggressive reductions.
BP said net debt climbed to $30bn compared with $25.1bn a year ago, lifting net debt-to-enterprise value some five percentage points to 23.6%, by the group’s own calculations. That edged BP further above the average of European oil majors than before, according to Thomson Reuters data.
Finally, we throw in BP’s gross dividend yield, which my Eikon terminal tells me was running at 8.2% on Tuesday. That’s certainly above the yields indicated for BP’s closest rivals, thereby continuing to flash the traditional warning for those dependent on returns.
In fact of course, the group’s dividend policy currently places it among the most uncertain payers in the entire FTSE 350, where a spate of reductions and suspensions in mining and oil have pushed yields relative to these sectors into triple digit percentages.
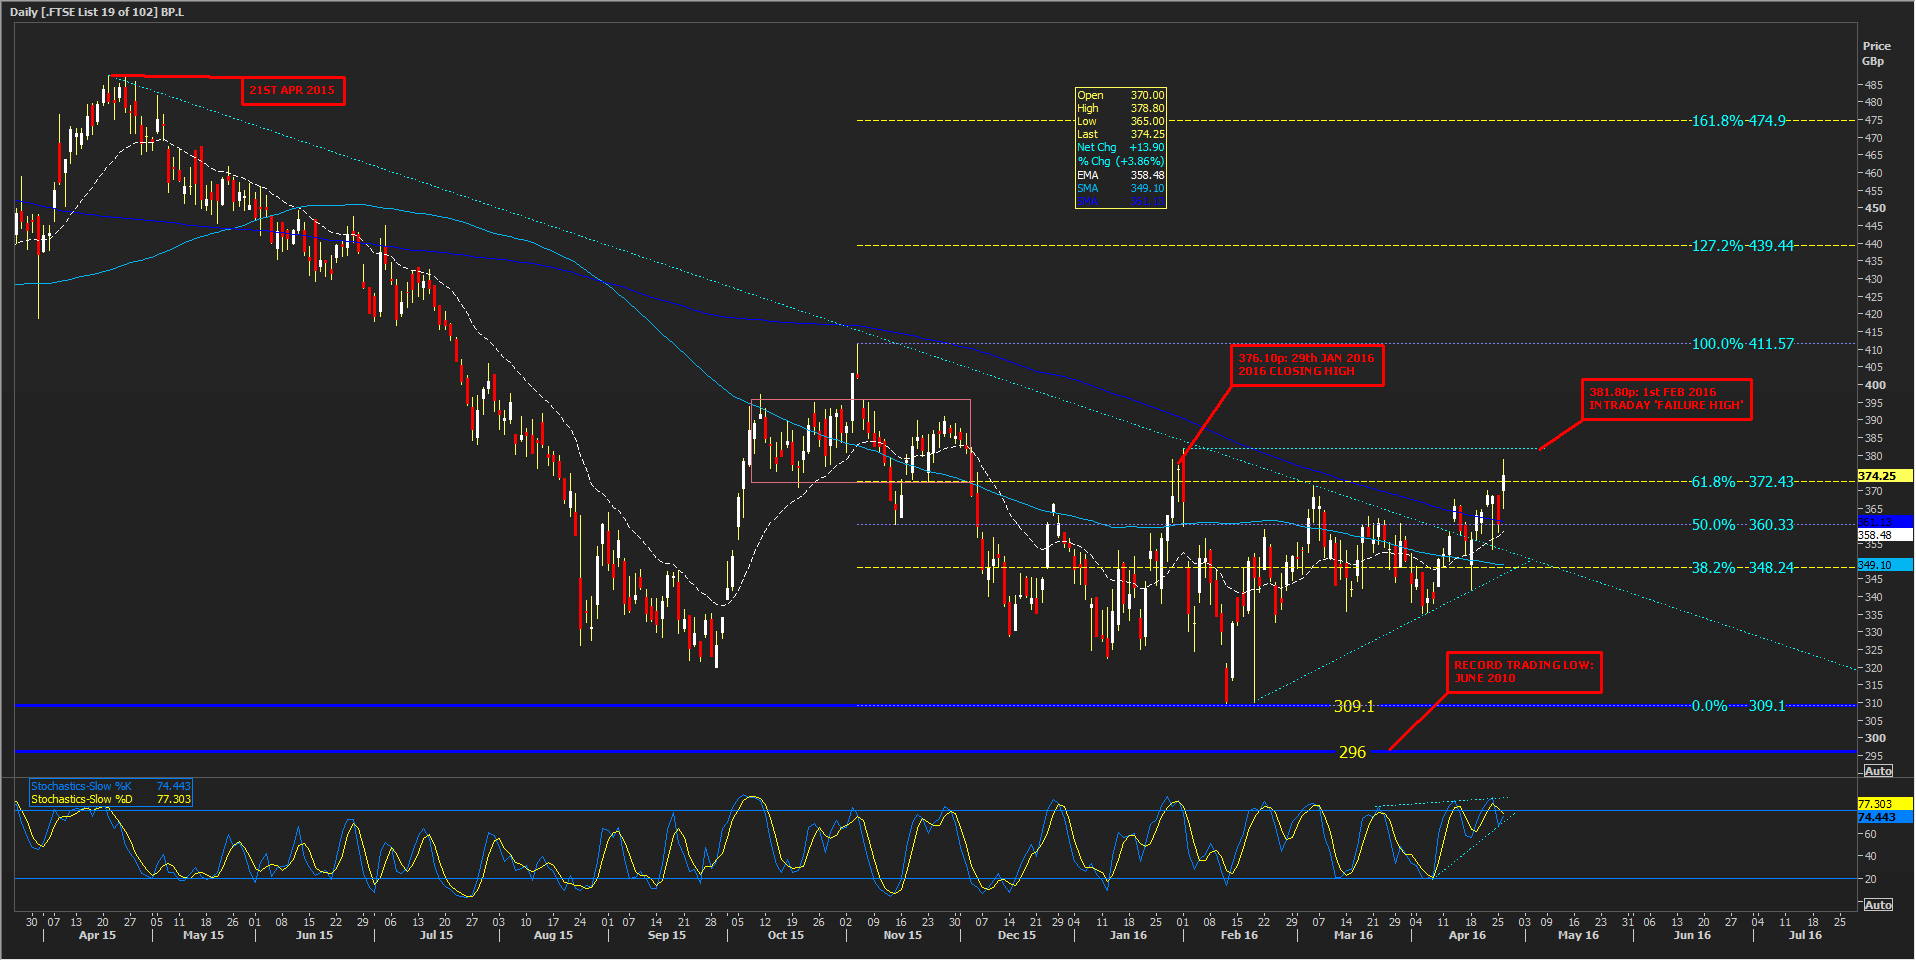
From a technical perspective BP’s stock, like the shares of many of its large-cap resource producing rivals, has broken above a long-standing falling trend, suggesting investors by and large believe the group has turned a corner. Whilst in BP’s case the trend is a little over a year old, compared to several years for groups like Anglo, for example, the oil share on Tuesday crossed some technical thresholds thought by traders to be important.
These include the 61.8% Fibonacci marker of the stock’s November-February decline to five-year lows.
The scene looks set for a showdown between bulls and bears in the near term at this year’s intraday high of 381.80p, seen on 1st February, with bonus points for bulls if they can hold prices paid at time of writing near 376p, matching the highest close in 2016, on 29th January.
The candle from that day looked far less robust than the one prices had etched at last check.
If BP can get beyond 376p-382p highs and a consolidation zone seen between September and November 2015, before 100% of the current retracement (411.60p), a number of doubts about the stock would have to be put aside.
The upper end of that range was a distance of little more than 30p from prices at last look. But, looming consolidation aside (see Slow Stochastic sub-chart) we think there’s enough ambivalence in the fundamental picture to make it one of the most critical eight percentage points the stock will have to surpass this year.
Please click image to enlarge
