BP shares lighter after breaking ten year downtrend
The latest in a string of 52-week highs for Brent crude oil lifted U.S. oil shares on Monday and could extend recent rallies for British oil majors too this week, particularly BP.
The latest in a string of 52-week highs for Brent crude oil lifted U.S. oil shares on Monday and could extend recent rallies for British oil majors too this week, particularly BP.
Unexpectedly wholehearted support from Russia, one of the largest non-OPEC producers, of the organisation’s planned output curb, announced last month was the cue for global oil benchmark to exceed June highs and touch $53.73, last seen on 1st September 2015.
Oil bulls have Russia’s President Putin to partly thank for the strength of oil’s run of almost 5 percentage points from high to low.
“Russia is ready to join the joint measures to cap production and is calling for other oil exporters to join,” Putin said, speaking at an energy congress in Istanbul.
The effect on global oil shares has been predictably bullish. The oil segments of Europe’s STOXX 600 and the U.S.’s S&P 500 extended their outperformance of the wider stock market this year.
For investors, the crude oil price rally is a particular boon as they brace for the latest reports of likely value destruction from oil groups which will soon disclose quarterly reports.
Strong stock price rebounds this year may be trimmed in the wake of these results.
Still, with British majors Royal Dutch Shell and BP rising around 10% a piece in the space of a week before Brent’s new yearly high, could their shares enjoy further upside, especially given that they will not report quarterly reports for three further weeks, before both release results on 1st November?
From a technical perspective, charts of both Shell and BP point to continuation of recoveries that began this year, following their deepest falls for decades.
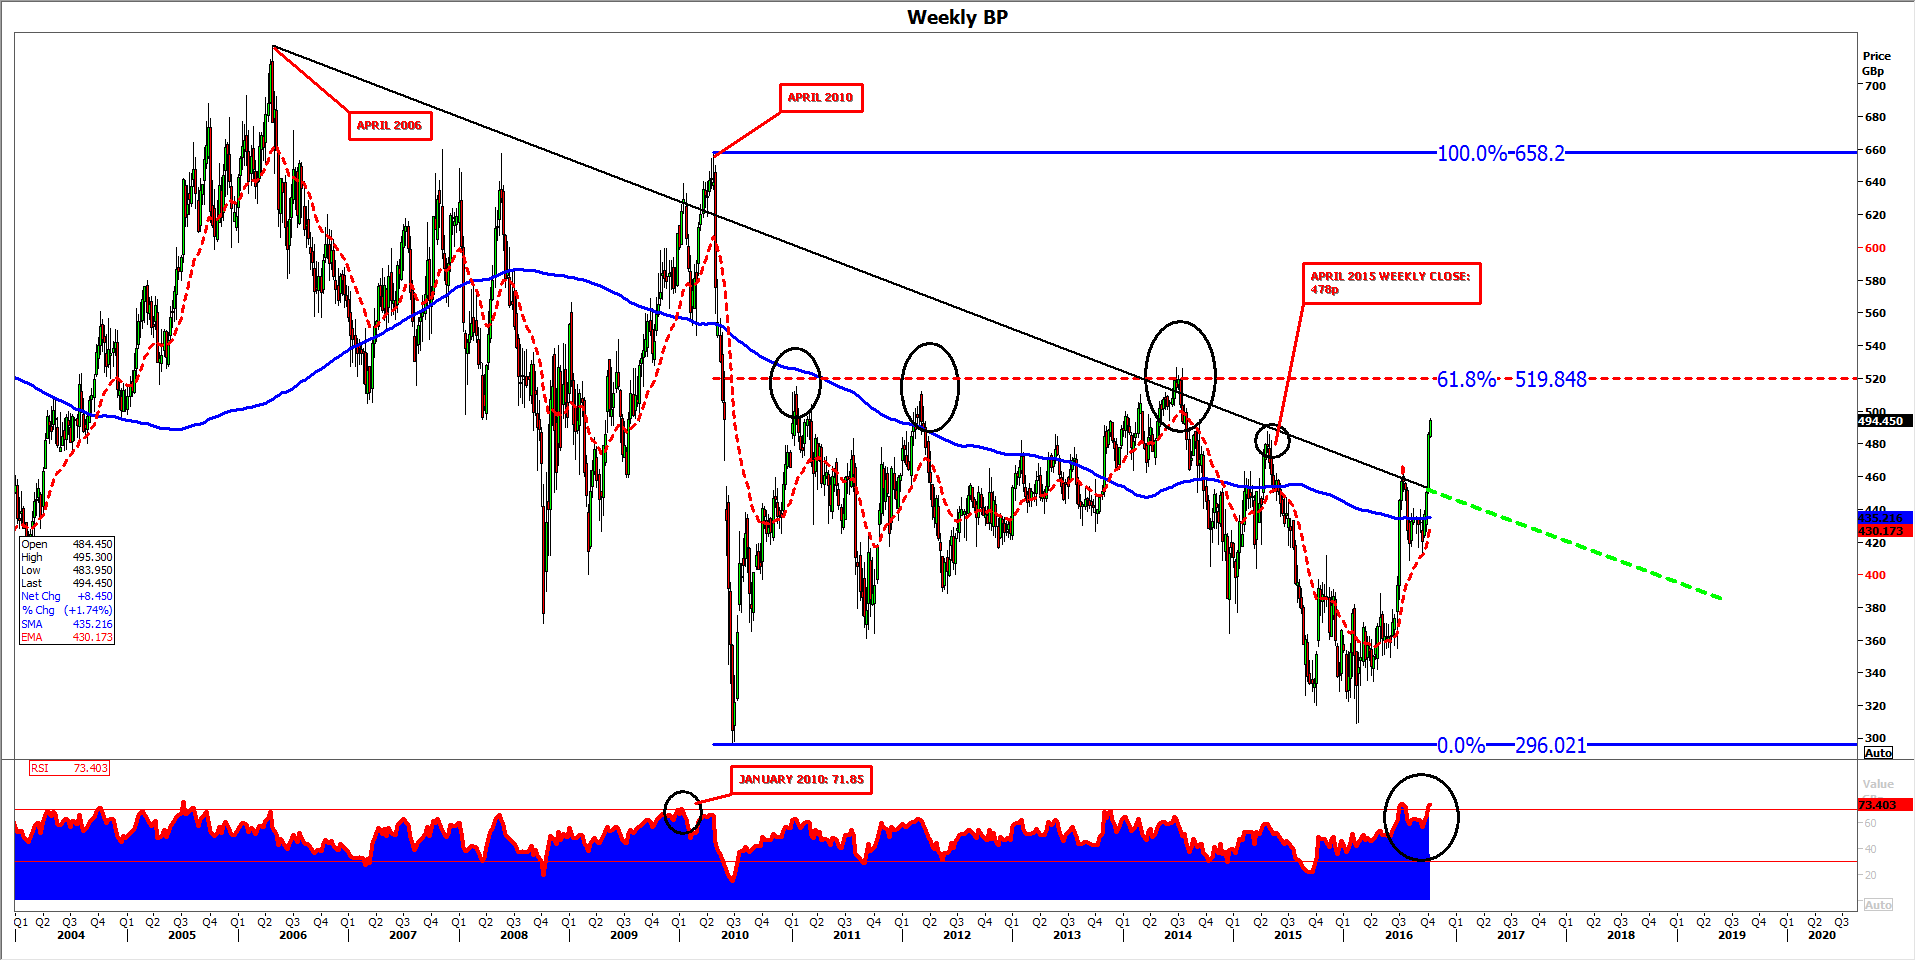
However, weekly views show Shell, which closed in London at 2116p, approaching a failure high from earlier in the summer at 2127p whilst BP broke the downtrend that had capped it since 2006, only last week.
In doing so, the latter sailed past a closely watched weekly close from April 2015.
Little now stands in the share’s way ahead of the 61.8% (519p) marker of its sharp April-July 2010 decline.
However, this price has blocked the stock’s attempts to recoup on three clear occasions over the last six years.
Furthermore, the Relative Strength Index for BP stock (sub-chart filled in blue) which gauges the speed and strength of changes in its price, has not been more ‘overbought’ since January 2010.
At that time, the traditional significance of its overbought state proved accurate in the months that followed, given that the shares more than halved between April and May of that year.
Even so, for the nearer future, even if BP is drawn lower in the coming weeks, a similar lag could still be a positive factor for its shares, in the absence of significant and immediate overhead impediments before 519p.
Please click image to enlarge
