Bovis shares flag overheated housing sector
Could the half-decade long rally by UK housebuilding shares be showing its first signs of wear and tear? Almost all major stocks in the sector […]
Could the half-decade long rally by UK housebuilding shares be showing its first signs of wear and tear? Almost all major stocks in the sector […]
Could the half-decade long rally by UK housebuilding shares be showing its first signs of wear and tear?
Almost all major stocks in the sector were in the red on Monday after integrated housebuilder and construction services firm Bovis Homes said its first-half pre-tax profit rose 9% higher, in line with market expectations.
It might be telling that there were few if any signs investors should doubt Bovis’s word that it is on track to deliver expected residential property volume for the year, but its shares still plunged as much as 7%.
Despite such strong momentum, investors may not be as ready to applaud Bovis’s “confident” outlook “for the year as a whole”, especially after a rise of its stock of almost 40% in 9 months.
But shares of Bovis are not the most potentially overvalued in the sector; Redrow’s stock is up 80% over the same period.
And of course, the whole sector has been surging for years.
Thomson Reuters’ UK Homebuilding Index has risen more than 500% since November 2010, 60% of that was added since the general election in May.
The sector has had a particularly strong run after the unexpectedly decisive election result, which paved the way for changes in planning consent.
The trend of news with respect to a probable interest rate hike in the UK has also been good of late, with the Bank of England sending a strong signal of increased caution in a raft of updates earlier in the month.
Perhaps, however, as the bar for stocks in the sector keeps rising, investors are getting pickier.
Bovis’s relative potential headroom on the upside against sector leader Barratt Developments is not expected to be fulfilled, looking at yields, with the former likely to continue to lead.
The sector’s spotlight will next fall on Barratt–it is scheduled to release half-year earnings on 9th September.
In the meantime it’s forecast to return 7.4% in twelve months whilst Bovis’s dividend yield is forecast to edge a few basis points lower to 3.6%.
Slightly lower-rated Crest Nicholson (forward price/earnings of 11.86 times against BVS’s 11.9x) pays more than Bovis—4.9% up from 4.3% at end 2014.
One further potential negative that investors may have latched on to: Bovis said on Monday it was assessing “the potential effect on future values available for affordable rented tenure social housing”.
This relates to the government’s intention to “control future movements in social affordable rental values” (i.e. by forcing social landlords to sell property to tenants.)
Local authorities and housing associations have voiced opposition to this move, introducing a potential snag in the development pipeline which might impact Bovis.
It builds 15%-20% of its homes for social housing, a higher proportion than most of peers.
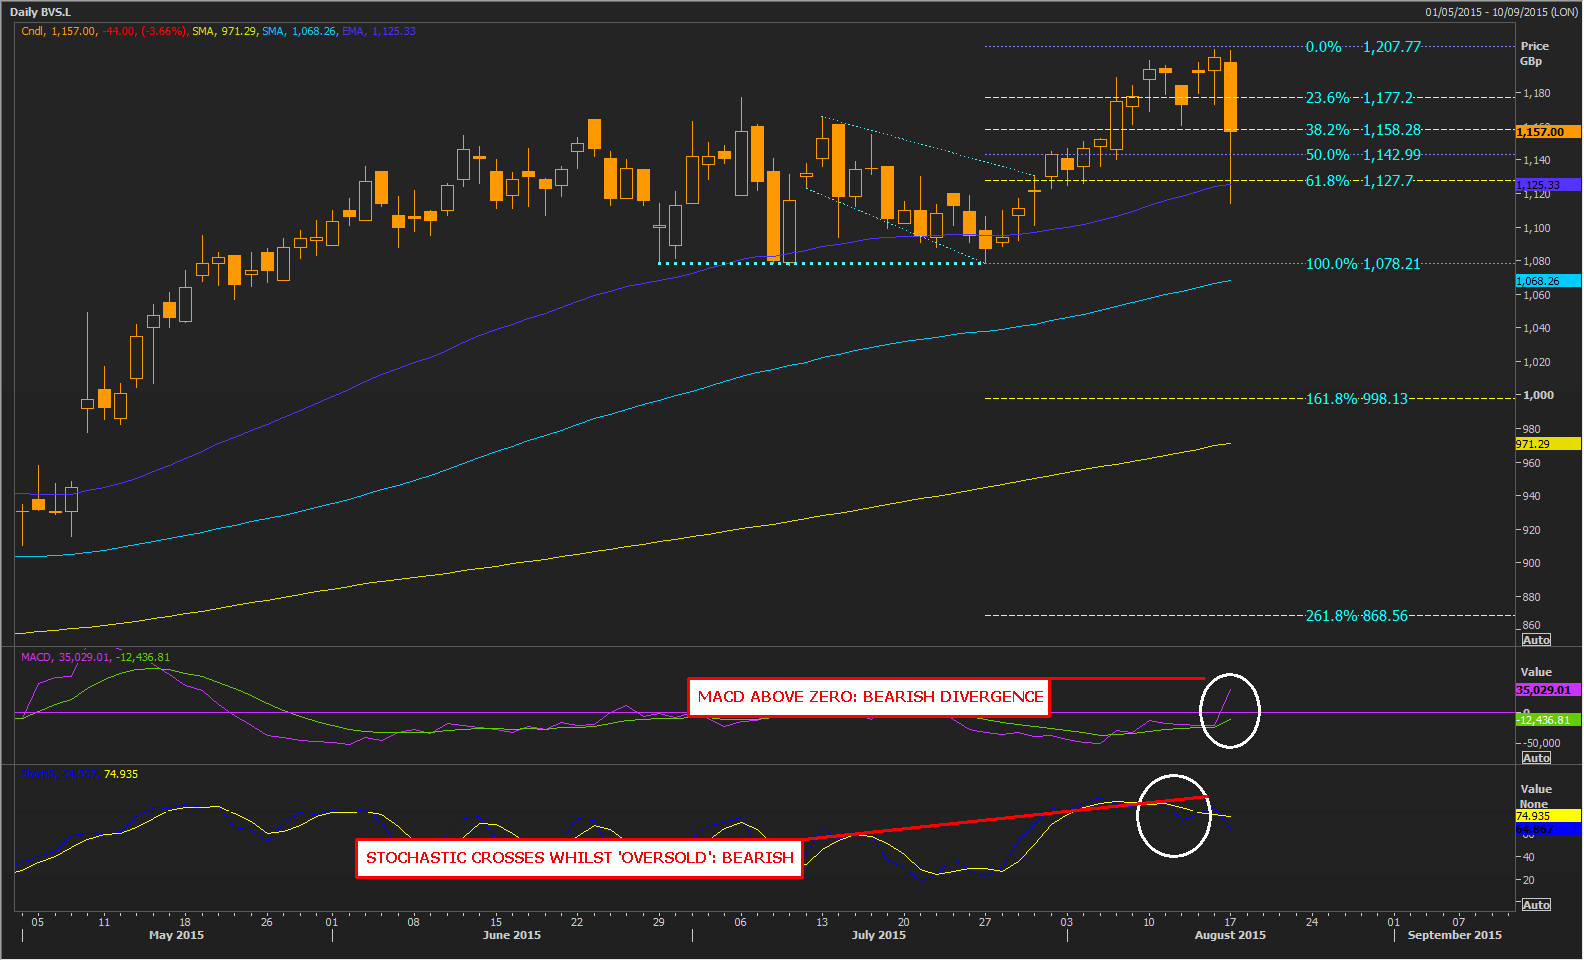
Either way, on Monday, the main point for Bovis shares was that strong consolidation signals had been triggered, coinciding with its half-year report.
A continuation pattern, from late July-early August (descending flag) albeit not entirely conclusive, did in fact see the stock stall at its theoretical limits.
Today’s dive also took the stock beyond an important retracement of the up leg since late July.
The loss of the level which ordinarily should have provided support warned of a potential continued sell-off.
The cross-over on the stochastic sub-chart (bottom, yellow and dark-blue lines) last week was in line with a need for consolidation.
At the same time, the slower-moving trend shown by Moving Average Convergence Divergence (MACD; first sub-chart; purple and green lines) indicates that some investors now have some catching up to do.
Divergence–MACD still rising–is regarded as bearish when out of line with price action.
It suggests buyers who have remained optimistic will eventually have to fall into line.
Please click image to enlarge
