


May 19, 2021 11:40 AM
Bitcoin selloff is good news for EUR/AUD and EUR/NZD longs
Bitcoin was our Chart of the Week in the Week Ahead on Friday. We noted that the cryptocurrency was pulling back from its April 14h highs in what could be considered a corrective manner. At the time, BTC was in the middle of a corrective channel (green) and just above the 38.2% Fibonacci retracement level from the November 26th lows to the April 14th highs, near 46,288. However, we also noted that it was forming a rounding top pattern, which is indicative of a possible reversal. Since then, price continued to move lower to the bottom trendline of the corrective channel, aided by comments from Elon Musk over the weekend and China’s central bank yesterday. Today, price broke aggressively lower below the 50% retracement and the 61.8% Fibonacci retracement levels from the previously mentioned timeframe, as well as the 200 Day Moving Average at 39,793. As of the time of this writing, today’s low was 30,066, which is a selloff of 30%.
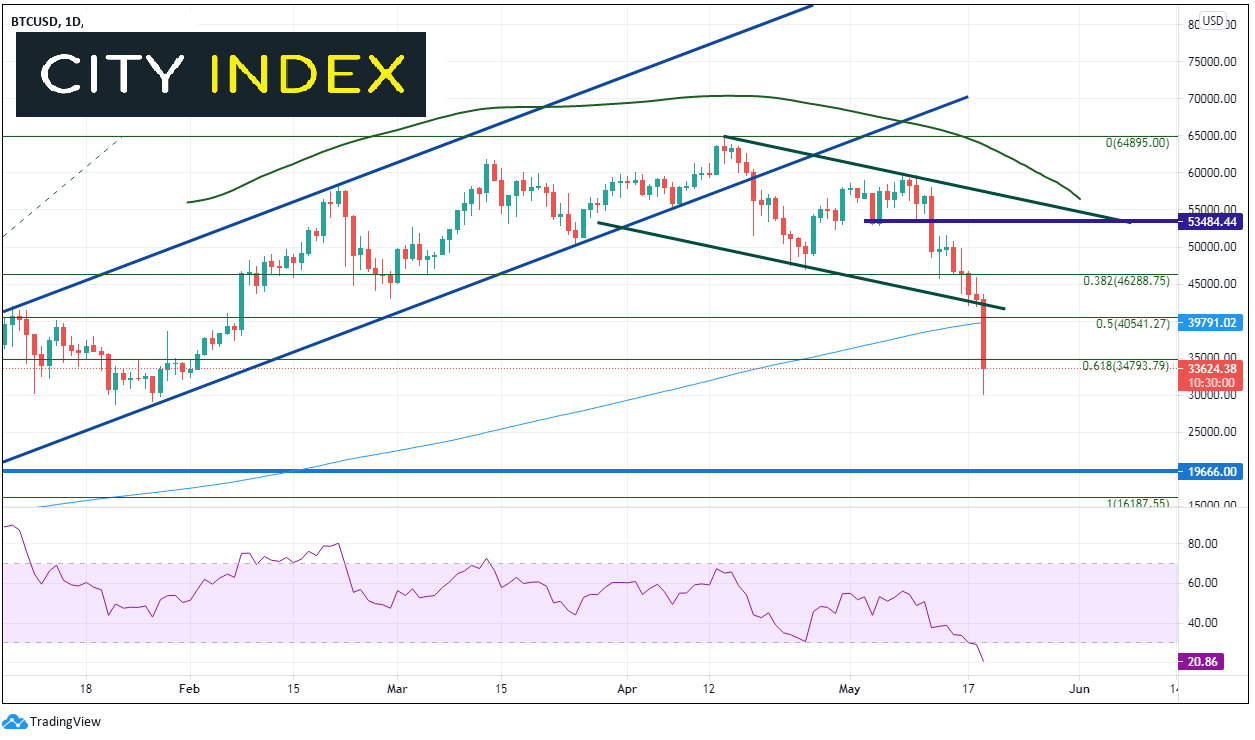
Source: Tradingview, City Index
EUR/AUD
Although the selloff in Bitcoin is bad news for crypto investors, it is good news for EUR/AUD! Notice that except for a few weeks in December 2020 and a few days in February, the correlation between EUR/AUD and Bitcoin has been negative (bottom of the chart below). Currently, the correlation coefficient between the 2 assets is -0.90 on a daily timeframe. A correlation coefficient of -1.00 means that EUR/AUD and Bitcoin move perfectly in opposite directions 100% of the time. The current reading is considered a strong, negative correlation.
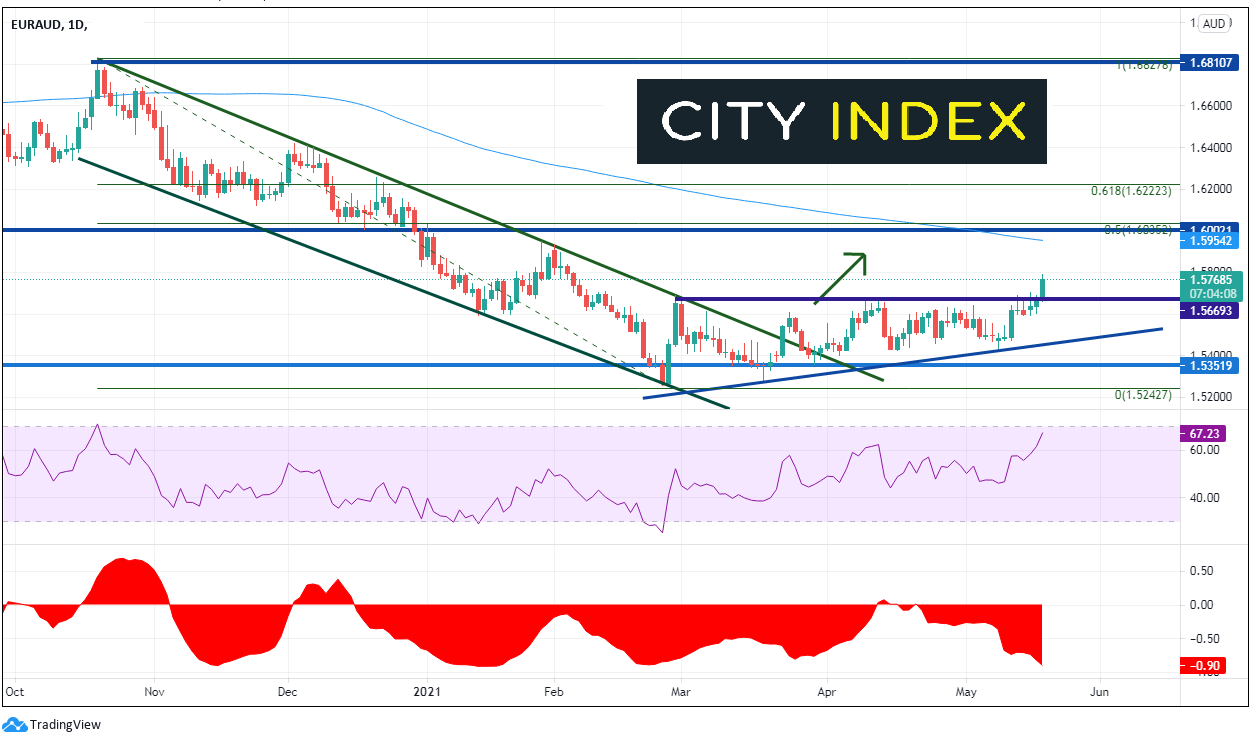
Source: Tradingview, City Index
EUR/AUD had been in an orderly downward sloping channel since mid-October 2020. The pair put in a low on February 25th of 1.5252 at the bottom trendline of the channel and immediately bounced to the top trendline. Price continued to trade in the channel until March 23rd, when price broke above the top trendline and formed a rising triangle. Today, price broke above the top, horizontal resistance of the triangle in earnest. Resistance above isn’t until the 200 Day Moving Average near 1.5954. Above there is previous support (now resistance) dating back to early 2020 and the psychological round number resistance at 1.6000. The 50% retracement level from the October highs to the February 25th lows is just above there at 1.6035, which is the 3rd resistance level. Support is at the breakout level of the triangle near 1.5670 and then at the upward sloping, bottom trendline of the triangle near 1.5460.
EUR/NZD
EUR/NZD has traded in a similar fashion to EUR/AUD, and also has a strong negative correlation to Bitcoin. Notice that the current correlation coefficient between EUR/NZD and BTC is -0.86 (bottom of chart below). This is also considered to be a strong negative correlation between the 2 assets, just slightly weaker than that of EUR/AUD and BTC.
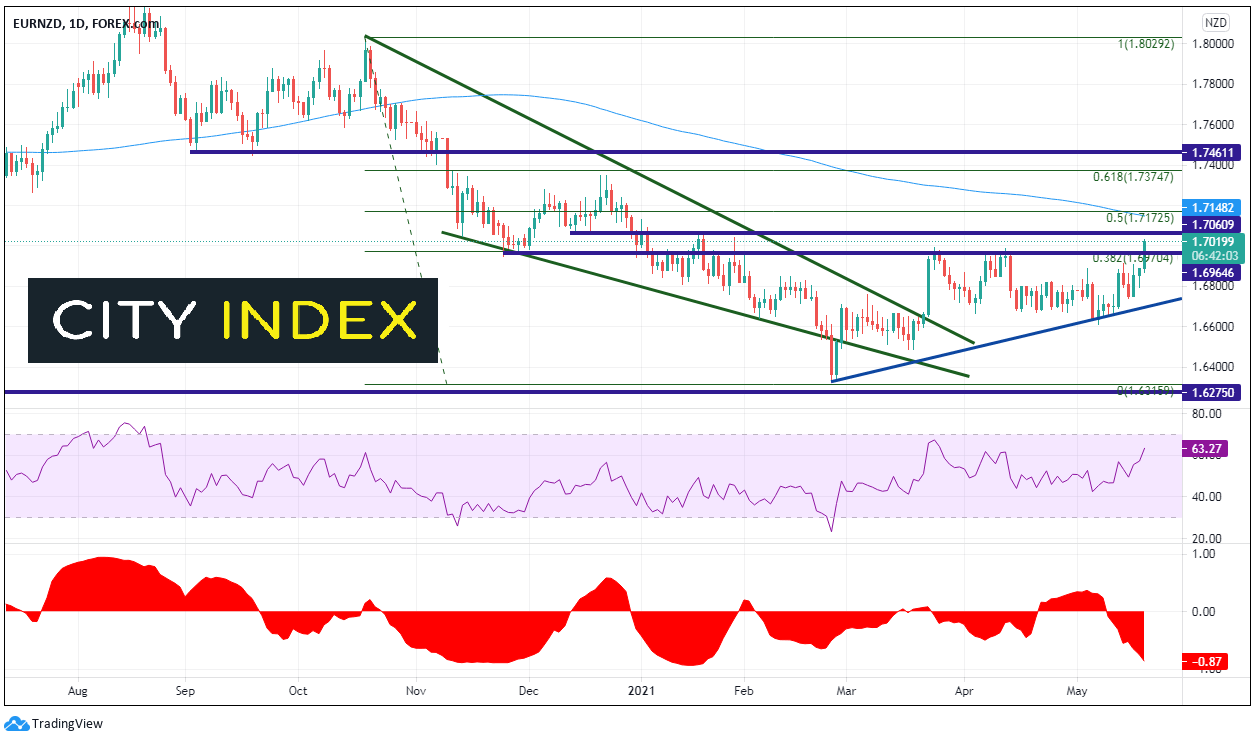
Source: Tradingview, City Index
Instead of trading in a downward sloping channel, EUR/NZD had been trading in a bearish wedge pattern. Price had a false breakdown below the wedge on February 24th, however rebounded the next day and moved to retest the top trendline of the wedge. On March 23rd, EUR/NZD broke higher out of the wedge and began forming a rising triangle. Today, price broke above the top, horizontal resistance of the triangle in earnest. Horizontal resistance just is just above at 1.7060, and then the confluence of the 200 Day Moving Average and the 50% retracement from the October highs to the February lows hear 1.7160/70. First support is at the breakout level of the rising triangle near 1.6965, then the rising trendline of the triangle near 1.6700.
For whatever the reason, Bitcoin and EUR/AUD, along with EUR/NZD, have a strong negative correlation on the daily timeframe. Therefore, traders can use these 2 currency pairs as a proxy for Bitcoin. If Bitcoin continues to sell off, one can expect EUR/AUD and EUR/NZD to go bid. HOWEVER, be aware that the correlation can change at any time! But, for now, it’s a strong negative correlation.
Learn more about forex trading opportunities.
Latest market news
Today 11:14 AM
Today 08:28 AM
Yesterday 03:30 PM
Latest Bitcoin USD articles
Yesterday 05:45 AM
April 15, 2024 07:13 PM
April 9, 2024 01:15 AM
March 21, 2024 11:48 PM