


November 21, 2019 5:01 PM
Bitcoin: FOMO, Headlines, and Technicals
What really drives the price of Bitcoin? (I’m taking away the obvious answer…supply and demand.) From what I can determine, it comes down to 3 things, ironically the same three things that are driving the stock market at the moment: FOMO or Fear of Missing Out, headlines, and technicals.
FOMO
Back in early 2017 when Bitcoin first made its name to the general public, FOMO was rampant. As is well documented, price moved from roughly $1000 at the beginning of that year to near $20,000 by year end. I remember being at holiday parties in December 2017 and having people ask me about cryptocurrencies such as, Bitcoin, Ethereum, and Ripple. Even my brother, a plumber, was asking about it. (It is considered a contrarian indicator when people outside of the financial community begin asking about a financial instrument that they usually would not know about.) We all know how that story ended as BTC ended the year near $4,000.
Headlines
Since the beginning of 2019, its been mainly headlines that have been causing BTC to bounce. Remember when Facebook announced they were going to jump into the Blockchain technology with Libra? Price of BTC bounced to $14,000. After that, China said they would investigate blockchain technology and so did the UK! (FOMO was involved in all these events as well). Who knows, new ECB President Lagarde is set to speak tomorrow and theoretically, she can mention blockchain technology as well. The one thing to note on each of these headlines is that the bounces were lower than on the previous headline, and the eventual selloffs have brought us down to today’s levels, near $7,500.
Technicals
On a weekly chart, Bitcoin has been in a large symmetrical triangle since putting it the highs back in late 2017. After putting in a low in 2018, price bounced on the Libra news, only to begin trading lower again. (Notice the upper wicks on the weekly candles throughout this year. These long wicks may be attributed to those to bought in late 2017/early 2018 and were looking to cut their losses.) Price has retraced to the 61.8% Fibonacci level from the lows in January to the highs in June. BTC is just above it’s 50 week moving average of $7,172 and there is a support zone just below between $6.000 and $7,000. But notice where price is within the triangle. If BTC continues to trade within the triangle, price may not breakout until 2021!
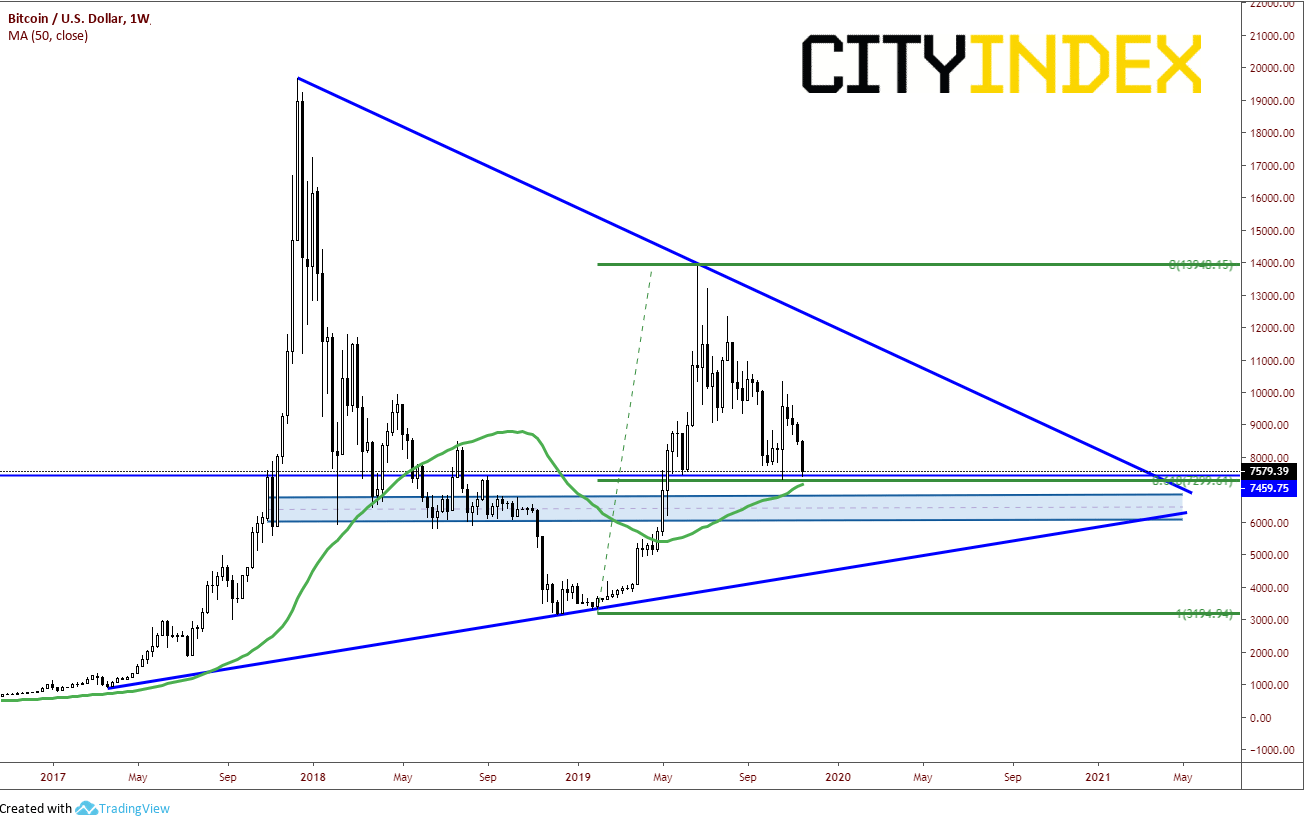
Source: Tradingview, City Index
On a daily timeframe, BTC is trading in a falling wedge. If price holds near these levels and breaks out to the topside, the retracement of a falling wedge is 100%. This would put price back near $13,000 and near the downward sloping trendline of the triangle on the weekly chart.
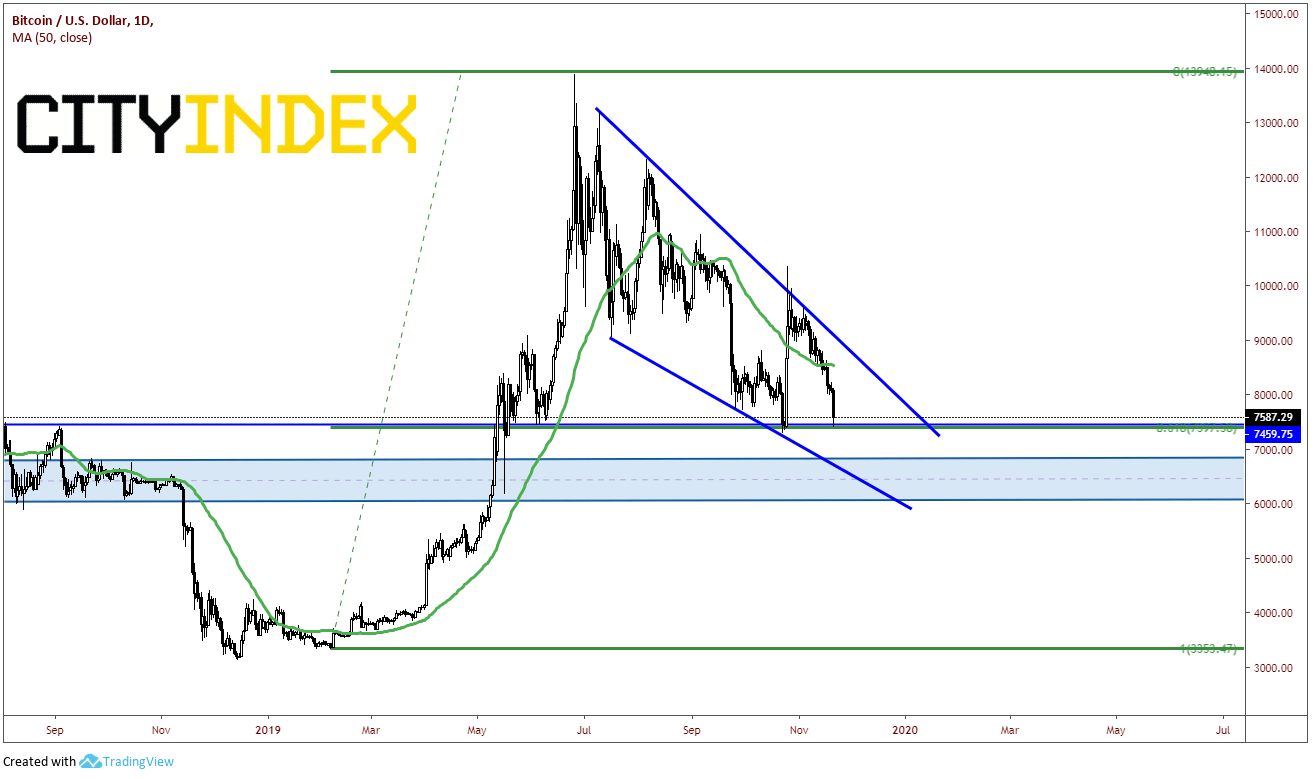
Source: Tradingview, City Index
On a 240-minute timeframe, today BTC broke through the bottom on the descending channel which price has been in since early November. However, the RSI is below 20, indicating oversold conditions and, therefore, Bitcoin may be ready for a short-term bounce, possibly towards horizontal resistance near 8000 or the downward sloping trendline near 8300. First support is at prior lows from October 23rd at 7292, then the 50-week moving average mentioned on the weekly chart.
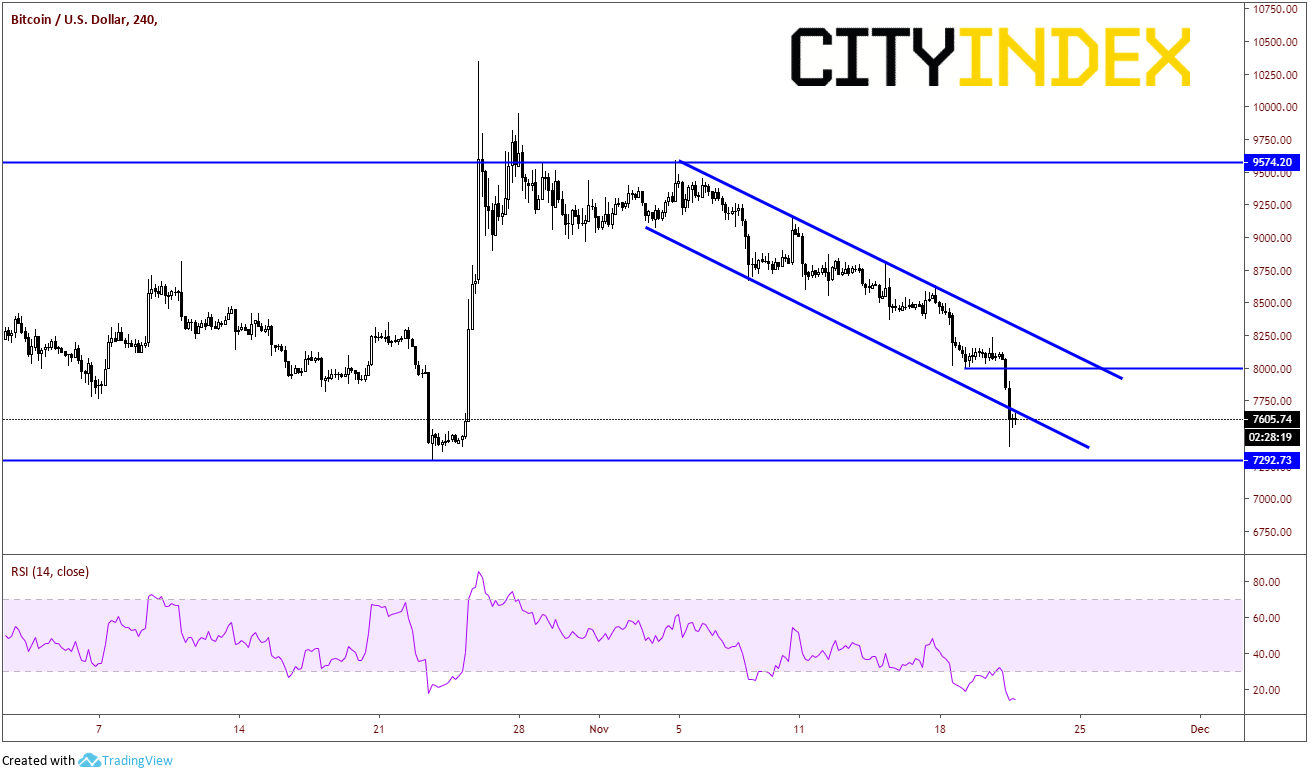
Source: Tradingview, City Index
If one owns Bitcoin and is looking to sell, we may be only a headline away from a bounce! At current levels, this may be an area where bulls look to buy, as price is well supported. Otherwise, one could wait as long as 2021 for price to break out near the apex of the symmetrical triangle.
Latest market news
Yesterday 03:00 PM
Yesterday 01:12 PM
Yesterday 11:14 AM
Latest Cryptocurrencies articles
March 12, 2024 11:00 AM
May 23, 2023 04:09 PM
April 27, 2023 02:08 AM
April 19, 2023 03:30 PM