BG shares spread uncertainty on Shell deal
Shell and BG stocks have now erased as much as three quarters of declines that followed news of their £55bn mega-merger in April. But investors […]
Shell and BG stocks have now erased as much as three quarters of declines that followed news of their £55bn mega-merger in April. But investors […]
Shell and BG stocks have now erased as much as three quarters of declines that followed news of their £55bn mega-merger in April.
But investors are clearly still ambivalent.
From their peak on 8th April, to lows just last week, Royal Dutch Shell and BG Group stocks fell more than 20% a piece.
Why?
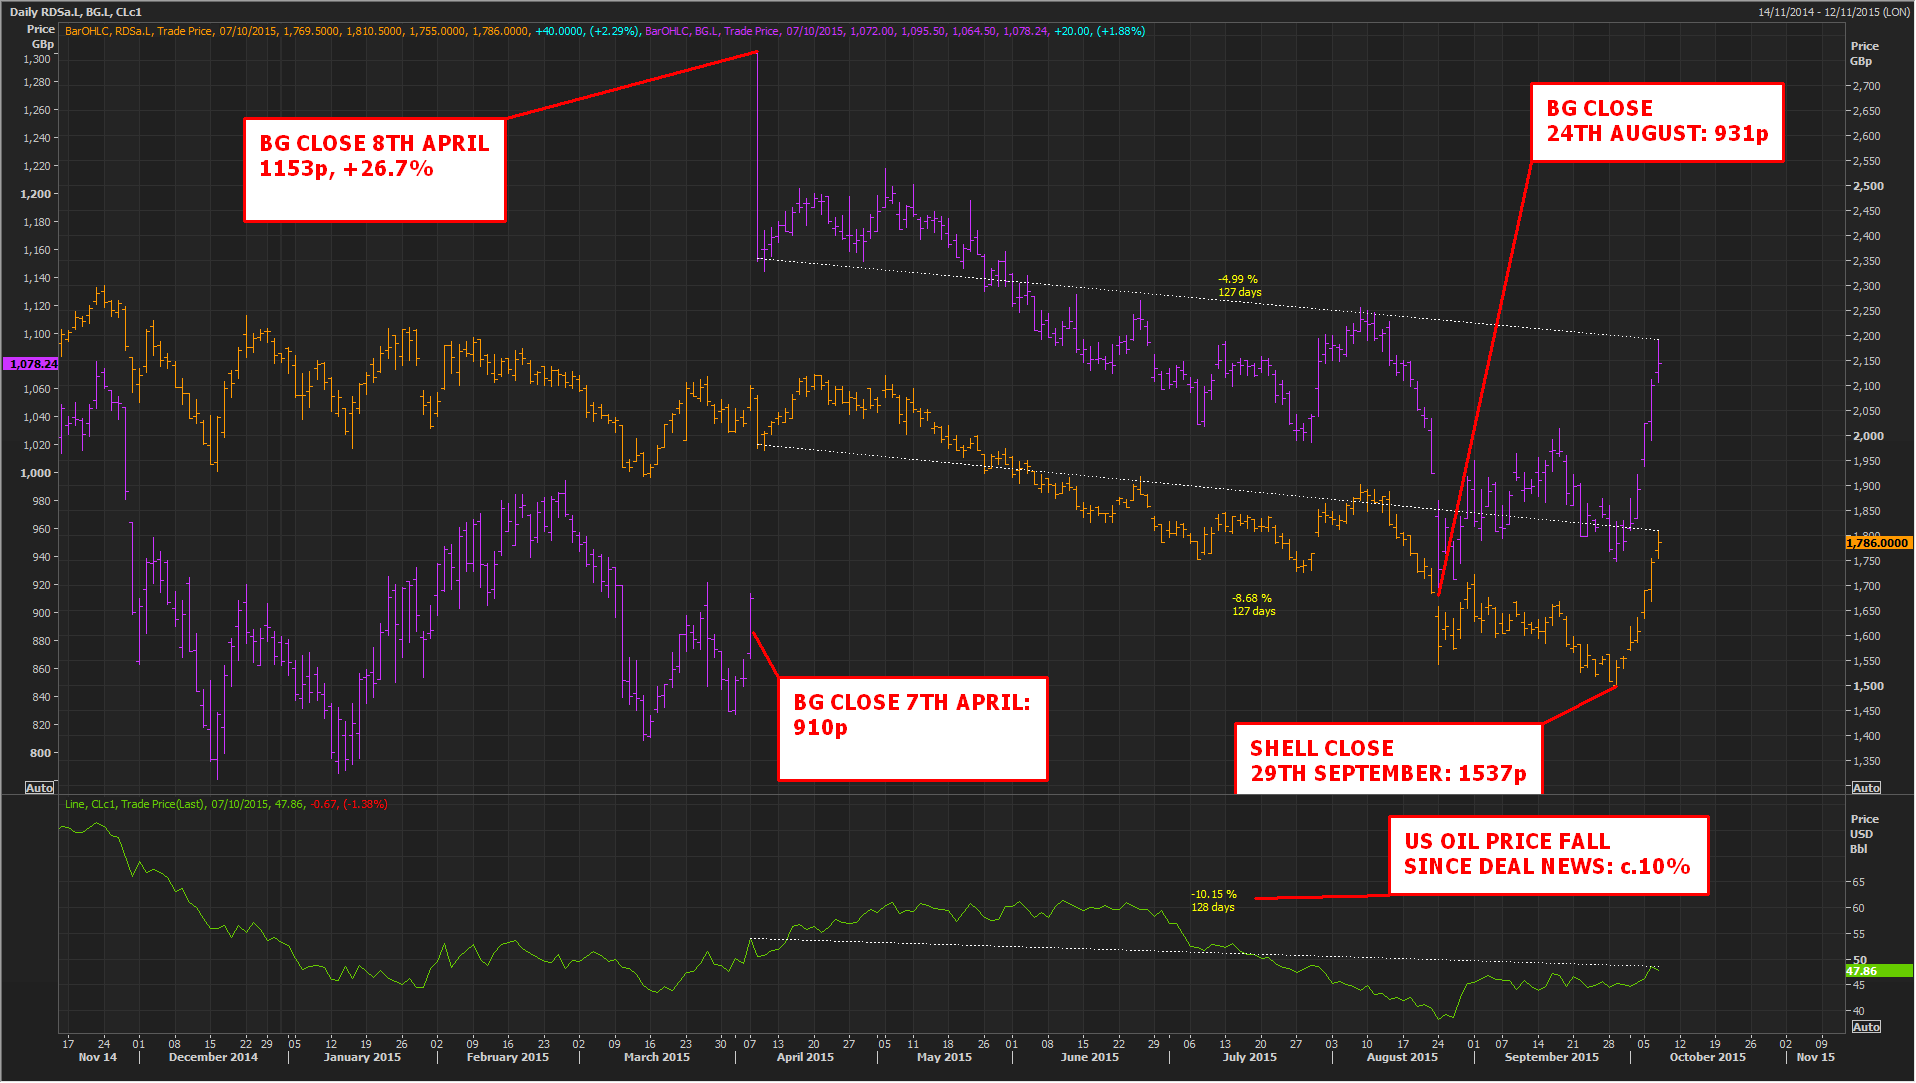
Please click image to enlarge
Aside from global market gyrations and oil price tankage, the web of regulatory clearances required to get the deal done has maintained an air of uncertainty.
Scares aside (namely in Australia) watchdogs have so far found few grounds for rejection.
Last month Brussels gave its green light, after the first from Brazil in July.
US authorities approved the deal in June, leaving just China’s and Australia’s regulators outstanding.
Australia’s Competition and Consumer Commission could still throw a spanner in the works when it announces its ruling in November, citing concerns that Shell-BG might place wholesale (export) priorities above domestic.
As disruptive as that would be, it’s never been the takeover’s biggest threat.
Instead, the most obvious flaw to the logic of the deal is that it barely makes financial sense.
On the face of it, the maths of the takeover stack up even less well now, with oil prices about 10% lower than late April, despite the bounce seen since late September.
Shell agreed to pay a 50% premium ($24bn) to BG’s market value on the day before the takeover was aired.
But even though BG’s stock was still 5% lower at the end of Wednesday trading vs. 8th April, the deal remains pricier for Shell because it agreed to pay for about 70% of BG with its own stock.
More to the point, the premium trumps even the upwardly revised $2.5bn synergies assessment Shell squeezed past strict takeover rules in July.
These statutory limits are designed to prevent over-optimistic announcements of possible merger savings.
Instead Shell directed investors to so-called “value synergies”, which the takeover rules are supposedly too inflexible to quantify.
Has Shell reassured BG investors that it will not be tempted by a relatively lenient £750m non-complete penalty, under any circumstances?
BG investors do not look 100% convinced.
The spread between the deal’s value and BG stock has never closed, even on the day when Shell’s announcement sent BG’s stock 26% higher.
The formula for the deal’s value is of course identical to the ‘terms of the Combination BG shareholders will be entitled to receive.’
For each BG Share: 383 pence in cash; and
0.4454 Shell B Shares
BG shares traded 10% off the bid on that day and have seldom been much closer than 9% since. (The spread was 9.17% as this article went online).
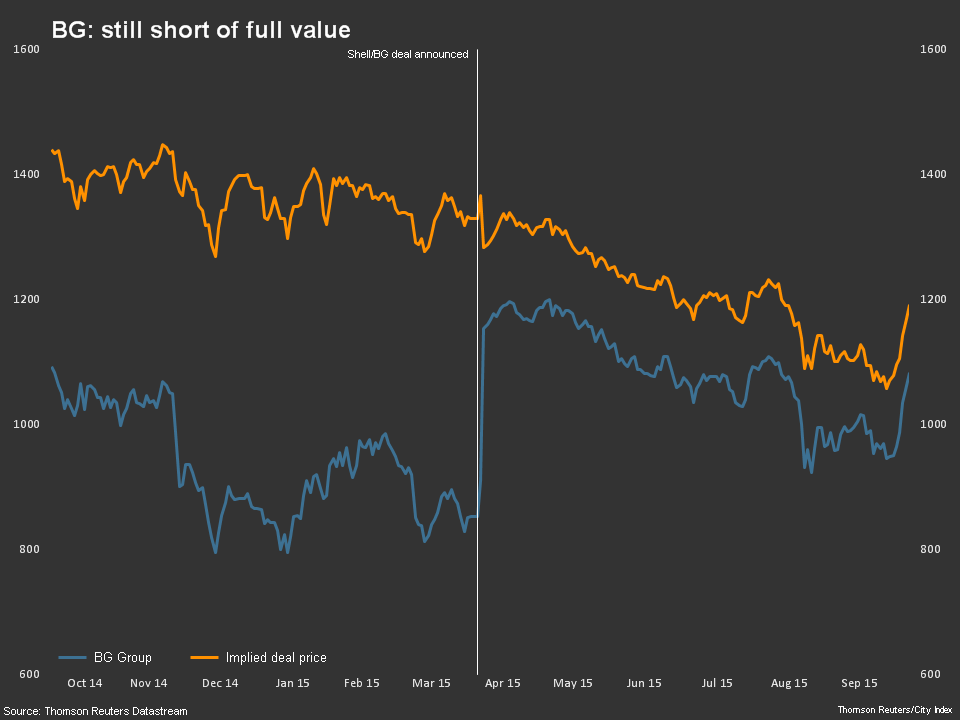
Please click image to enlarge
Admittedly, the putative deadline for the takeover’s completion in April 2016 gives ample time for the shortfall to be filled.
During that time, investors may warm to be the notion that cost cuts could be as high as $5bn, using historic combinations of other oil behemoths as benchmark.
Shell-BG’s potential control of a fifth of the LNG market might also be appreciated more widely.
But in the meantime, the spread is likely to remain open, absent a major oil price recovery.
The 50% takeover premium is impermeable after all.
The fact that oil ideally needs to fetch closer to $70 per barrel than current $48 before the deal gets compelling, is also difficult to argue with.
For traders, that means BG and Shell shares will remain locked in a close but not quite committed embrace for the foreseeable future.
A short on both stocks would have returned more than a pair trade since April, but the spread is still useful nonetheless.
Both shares have rallied strongly from late August lows and are close to ‘technically overbought’ in their daily timeframes.
Yet, with BG’s main stochastic line (the deep-blue line labelled ‘%K’ in the sub chart) some 77 points beneath Shell’s, BG could yet overheat a bit more in the very near term, if the spread remains intact.
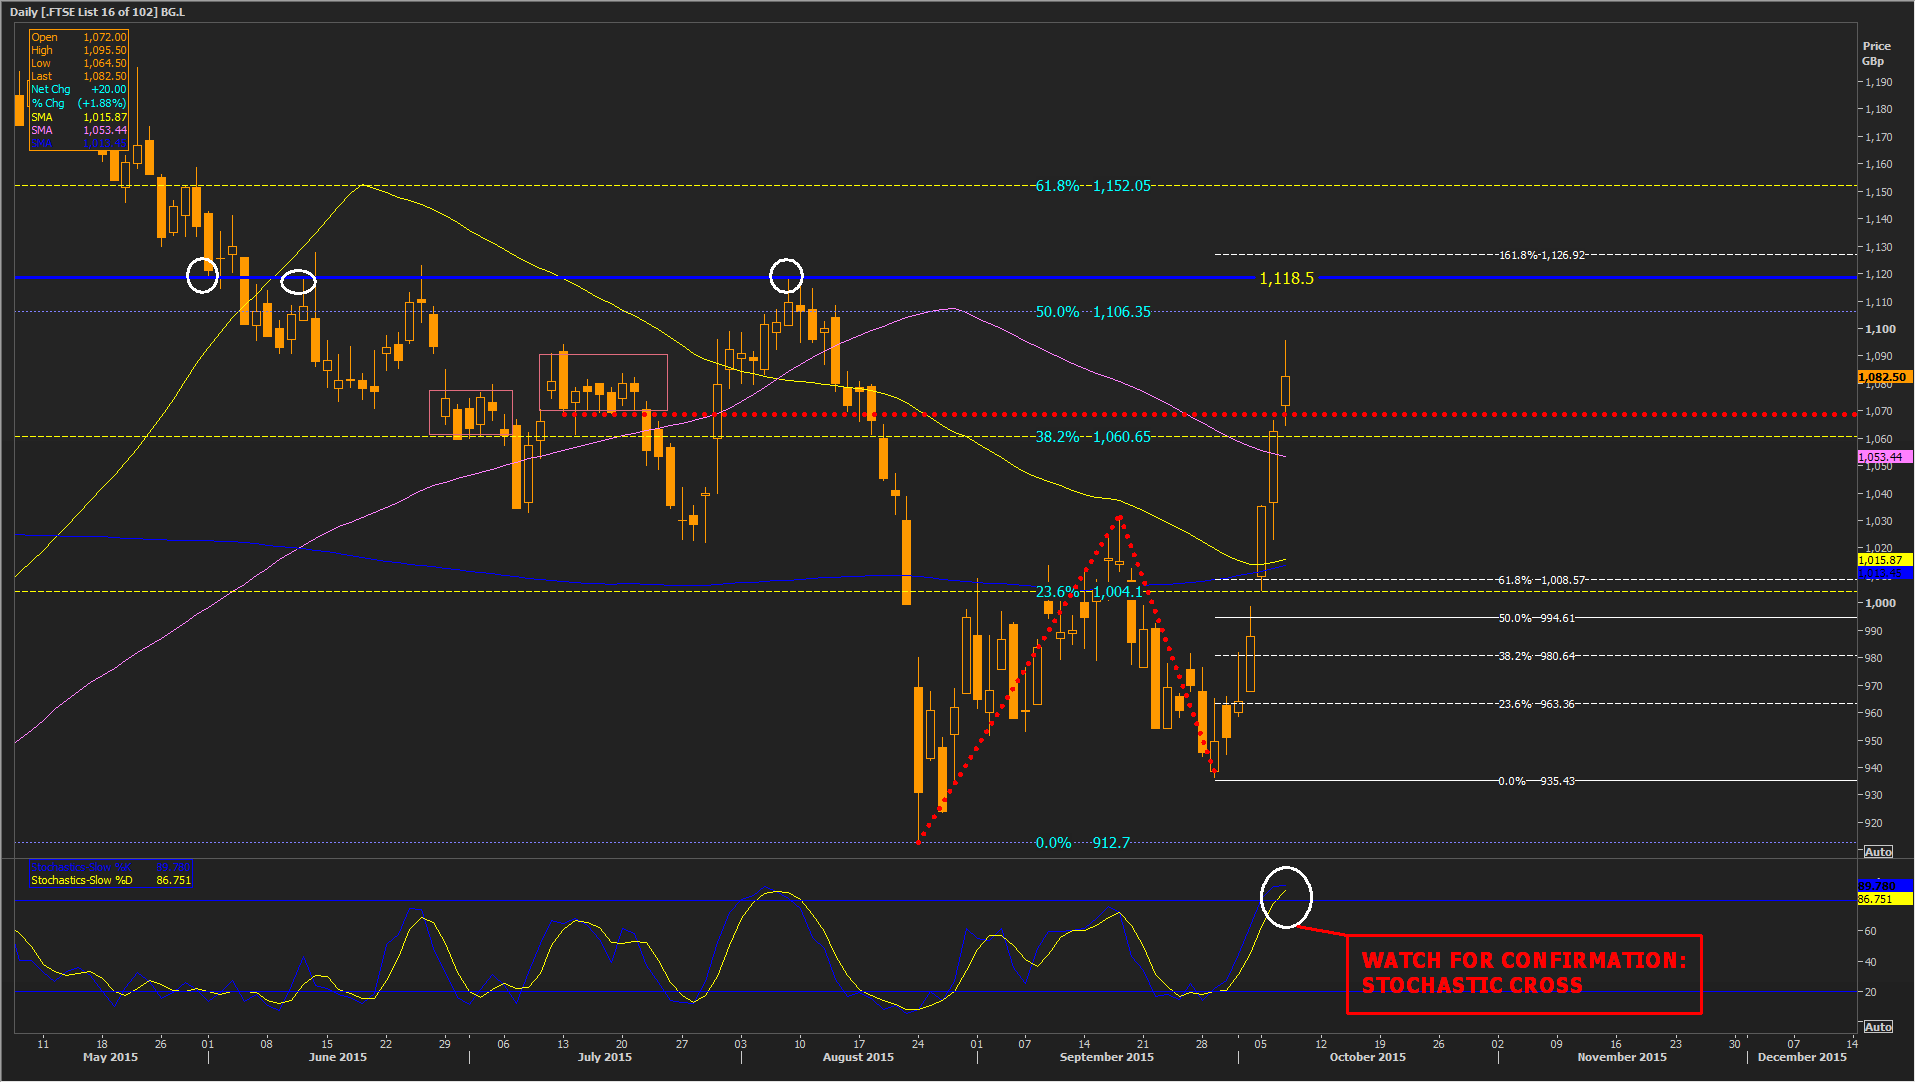
Please click image to enlarge
But 50% of the fall from April highs would probably be BG’s upside limit in the near term; at 1106p, quite a stretch from 1118p resistance/prior support.
If (more likely when, in the near term) support at 1070p gives way, the 38.2% marker (1060.7p) would be the next target.
Then the 100-day MA (1053p), before possible 1008p support, almost exactly 110p away from tonight’s close.
1008p matches a 61.8% extension from August lows.
As for RDSA, it is turning back, after having gone close to its own extension (161.8%: 1793p) from the failed late August/early September advance.
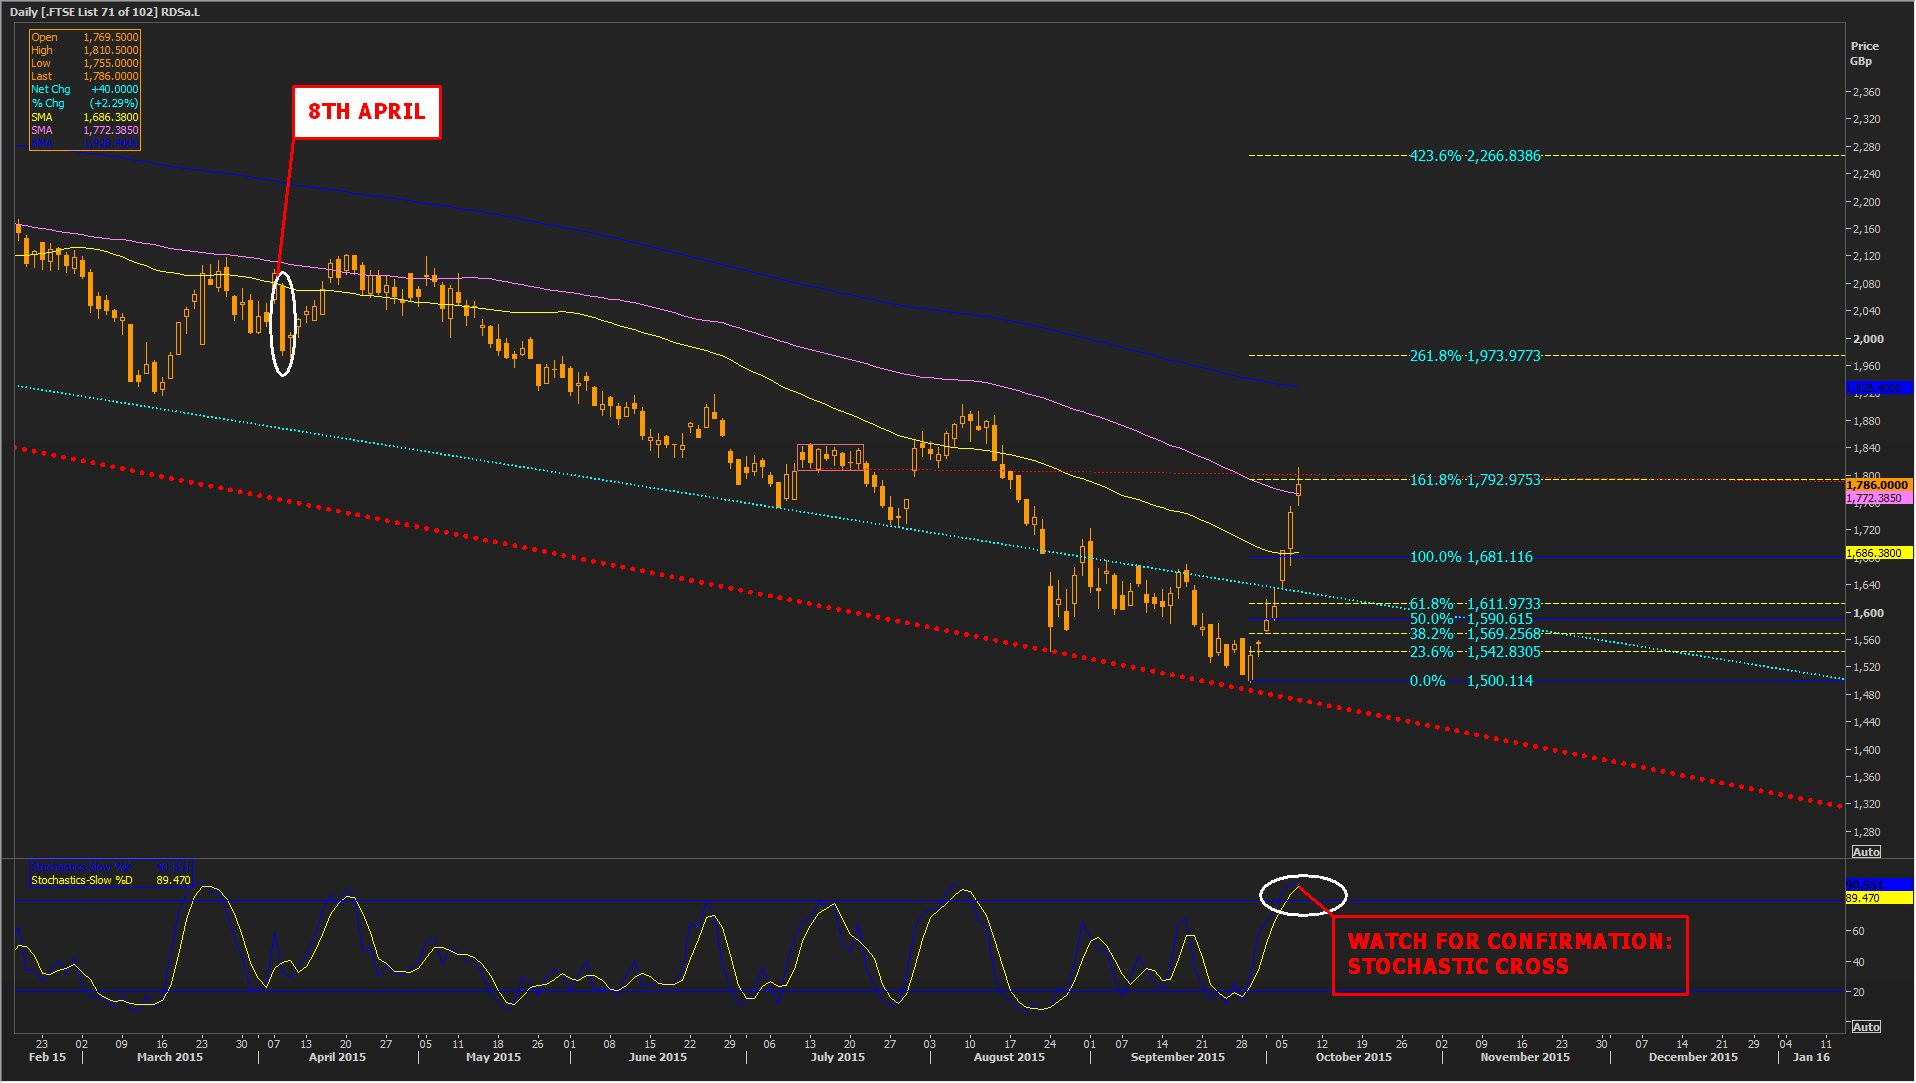
Please click image to enlarge
Previous support around there will now resist (1800p).
Once through its 100-day MA, a quick give back of Tuesday’s rise up from 1689p seems likely.
A pause is likely at the later as it’s near the 50-day MA and 100% of 29th Sept-6th Oct.
