BG shares rocket 40 after Shell offer
Updated 1100 BST Long anticipated consolidation of the UK’s big energy companies may have begun, with Shell’s offer to buy BG Group for £47bn. Shell […]
Updated 1100 BST Long anticipated consolidation of the UK’s big energy companies may have begun, with Shell’s offer to buy BG Group for £47bn. Shell […]
Updated 1100 BST
Long anticipated consolidation of the UK’s big energy companies may have begun, with Shell’s offer to buy BG Group for £47bn.
Shell and its smaller rival said in a joint statement on Wednesday morning the former proposed 383p per share in cash plus 0.4454 of a Shell ‘B’ share—all in the package is worth 1350p for each BG stock.
It represents a 50% premium to the 90-day trading average price of BG shares.
It’s one reason why this morning we can marvel at the rarely seen spectacle of a FTSE 100 stock moving more than 20% in less than an hour.
BG Group shares traded about 40% higher as this article was about to go online.
At about 1253p though, the share price was still 100p lower than the value implied by the total package Shell offered.
The reasons for that discrepancy include the probability of extensive negotiations between Shell and regulatory authorities, in the UK, Europe and beyond.
Additionally, this bid in fact appears to have been unsolicited, strictly speaking.
Even if BG and Shell have quickly reached an agreement to the deal, approval is still required from BG shareholders.
Obviously the biggest share price impact of the news so far, has been on BG shares.
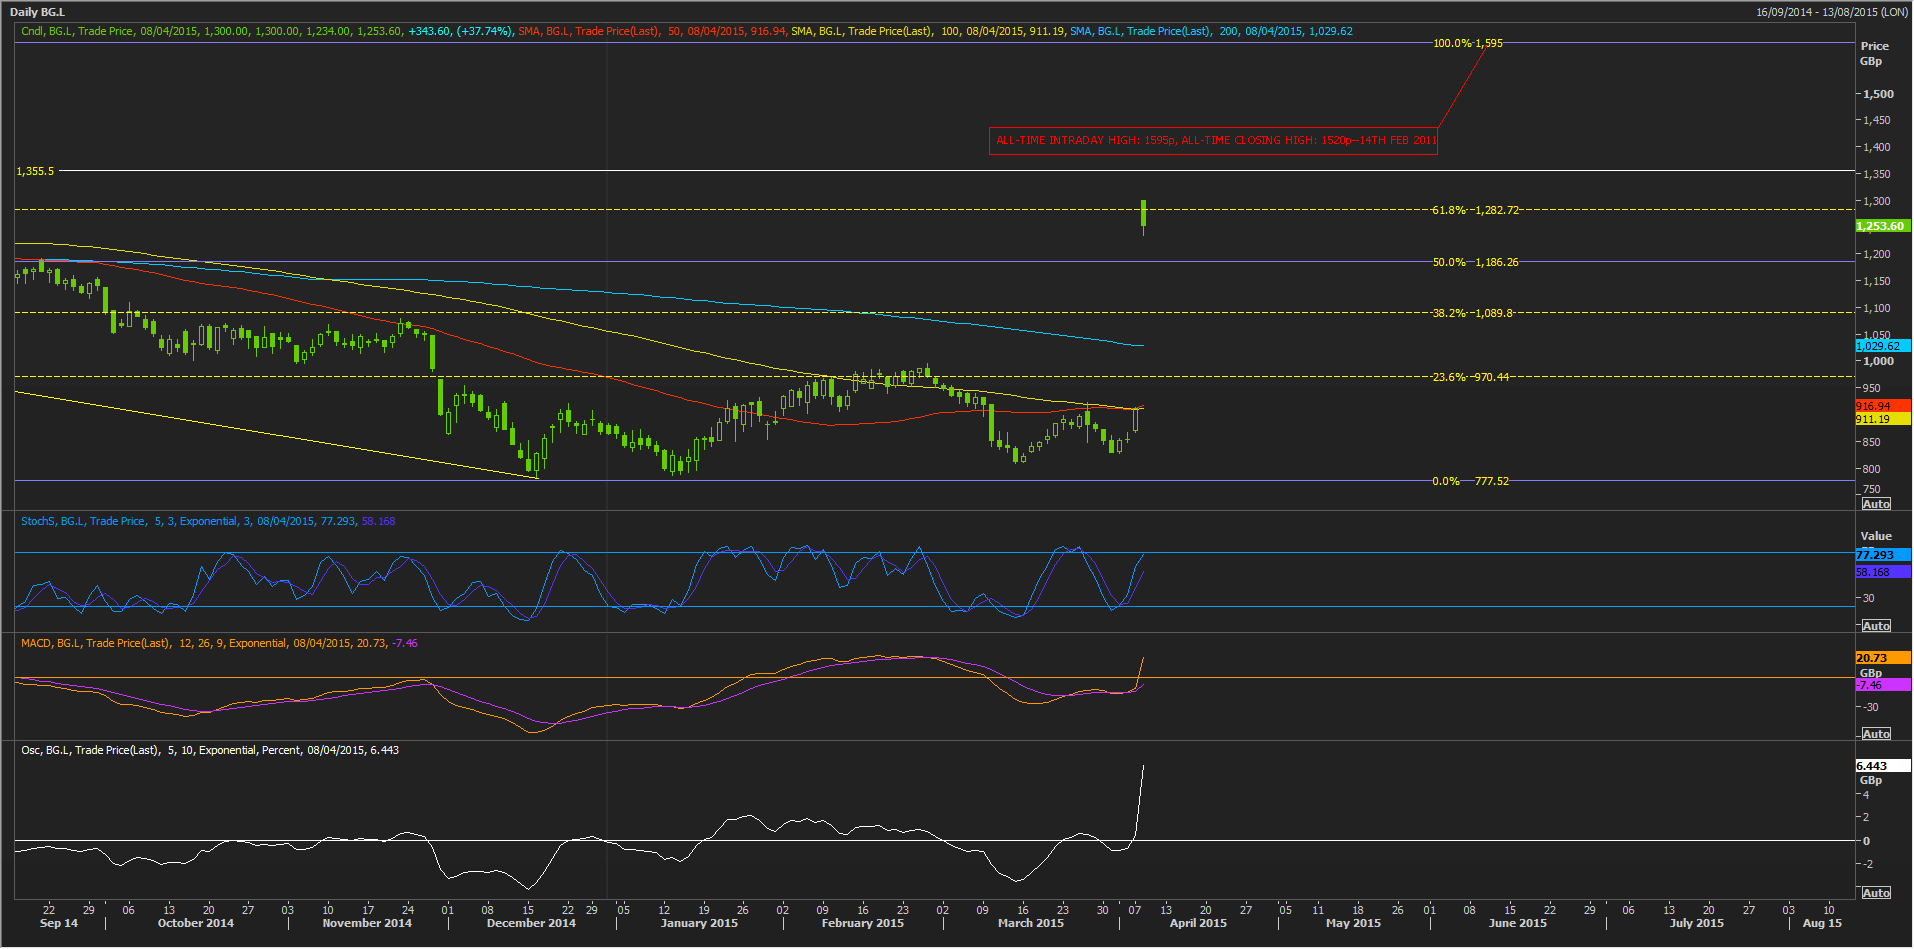
With the near-40% rise on the day this morning, BG has belatedly recouped almost all of its drop over the last year, finally matching the stock price recoveries of most of its rivals.
A rather obvious first target on the upside is the price at which BG’s long descent kicked-off in January 2014, at an intraday high of 1355.5p.
It’s just a little beyond the value of Shell’s complete offer.
First though, we perhaps might like to recall that retracements off the same low in December 2014, back up to BG stock’s highest trading price ever, in February 2011, raises a further challenge.
Commonly used retracement intervals imply the market may regard BG’s current price as significant, since it is straddling a 61.8% line, and that is often a ‘sticking point’ for prices on the way up or down.
Clearly, there’s no shortage of momentum though.
And whilst the long trade of BG shares in the daily time frame is certainly ripe, grounds for calling it ‘over-inflated’ have not quite been seen, yet, judging by the Slow Stochastic oscillator chart I have included directly under the price chart.
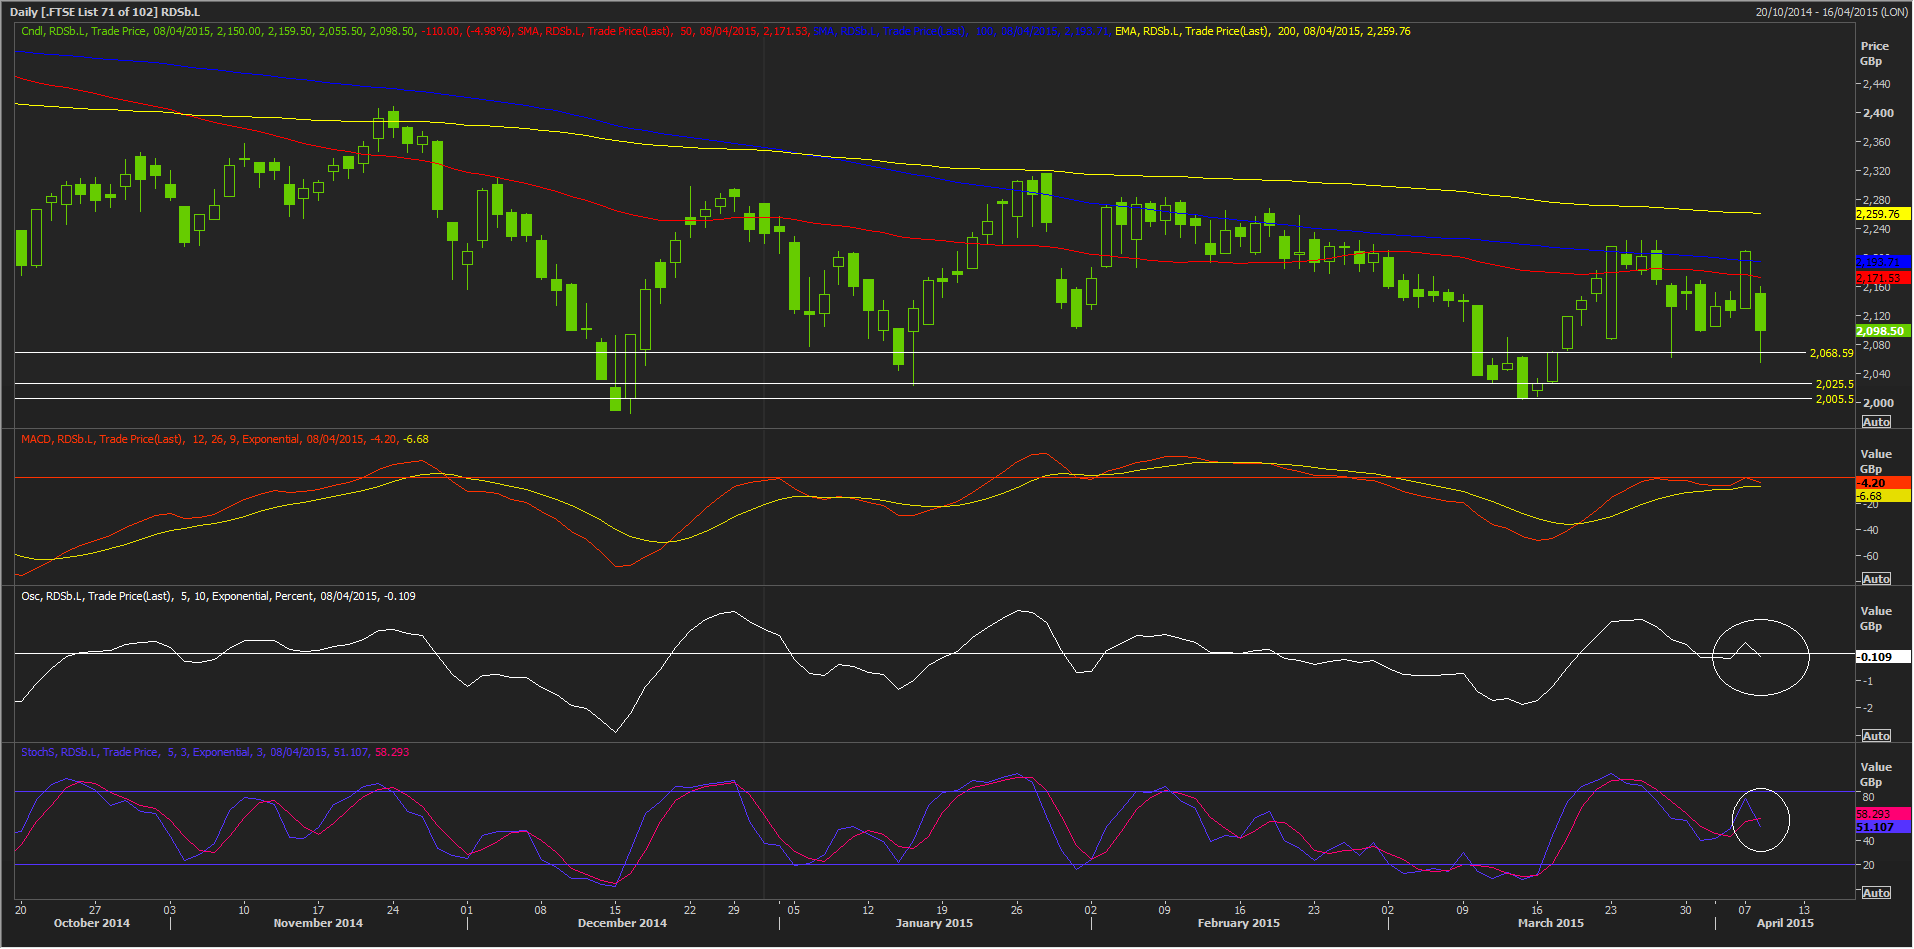
Trading in Royal Dutch Shell’s most liquid ‘B’ shares has, understandably, reflected far less ebullience in the wake of Shell’s offer.
Whilst the drop of as much as 5% this morning could be described as relatively contained, given that Shell stock has held off from a number of potential supports so far this morning, classically, it may be worth paying enhanced attention to moderate bearish divergence.
That is signalled in the Slow Stochastic Oscillator in Shell’s chart (sub chart at the bottom of the image).
The lighter line represents our ‘%D’ (‘smoothing’ 3-day exponential moving average) in this case.
Despite the fall of the stock price, its slight upward inversion highlighted that some residual upside momentum remained.
In context, the balance of probabilities suggests Shell’s intended transaction and the resultant uncertainty should lead to a lower share price in the medium-term than seen so far.
Especially as a more simplified momentum gauge, the percentage oscillator (white) has penetrated the zero balance–sellers have definitively taken over.