


Bank of America Corp (BAC)
click to enlarge charts
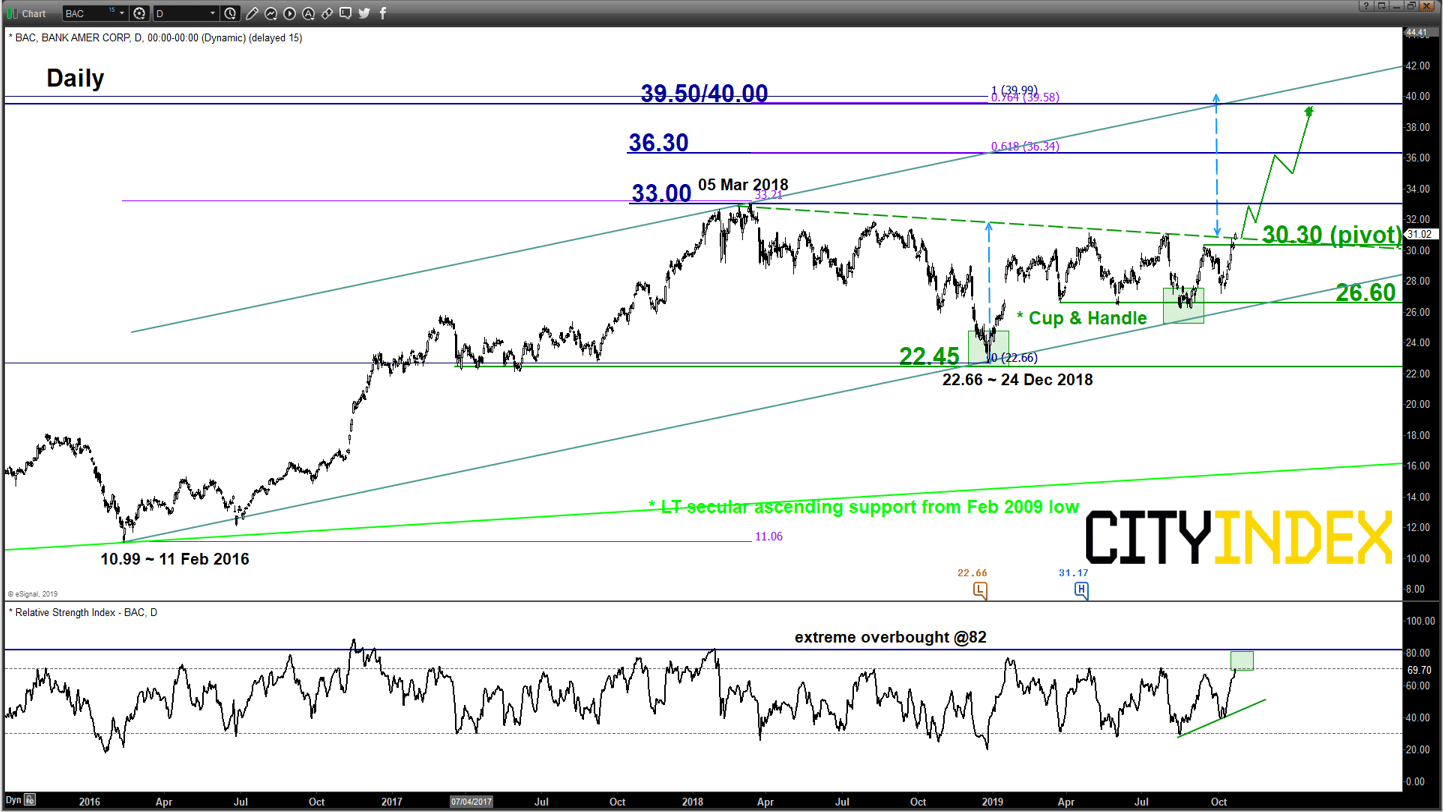
Key Levels (1 to 3 weeks)
Pivot (key support): 30.30
Resistances: 33.00, 36.30 & 39.50/40.00
Next support: 26.60
Directional Bias (1 to 3 weeks)
Bullish bias above 30.30 key medium-term pivotal support for a further potential upleg to retest the 05 Mar 2018 swing high area of 33.00 before targeting the next medium-term resistances at 36.30 and 39.50/40.00 next.
On the other hand, a daily close below 30.30 invalidates the bullish breakout for a choppy slide back to retest the range support of 26.60.
Key elements
- BAC has managed to stage a bullish breakout from a 10-month bullish continuation “Cup & Handle” range configuration in place since 24 Dec 2018 low with the neckline resistance of the “Cup & Handle” now acting as a pull-back support at 30.30.
- The “Cup & Handle” range configuration tends to indicate a potential bullish consolidation phase after a prior uptrend and a break above the “Cup & Handle” range resistance triggers the start of another up-trending phase.
- The potential bullish exit target of the “Cup & Handle” stands at 39.50/40.00 with confluences with the upper boundary of a major ascending channel from 11 Feb 2016 low, Fibonacci expansion cluster and 15 Sep 2008 major swing high.
- Medium-term momentum remains positive as indicated by the daily RSI oscillator which still has further room to manoeuvre to the upside before it reaches an extreme overbought level of 82.
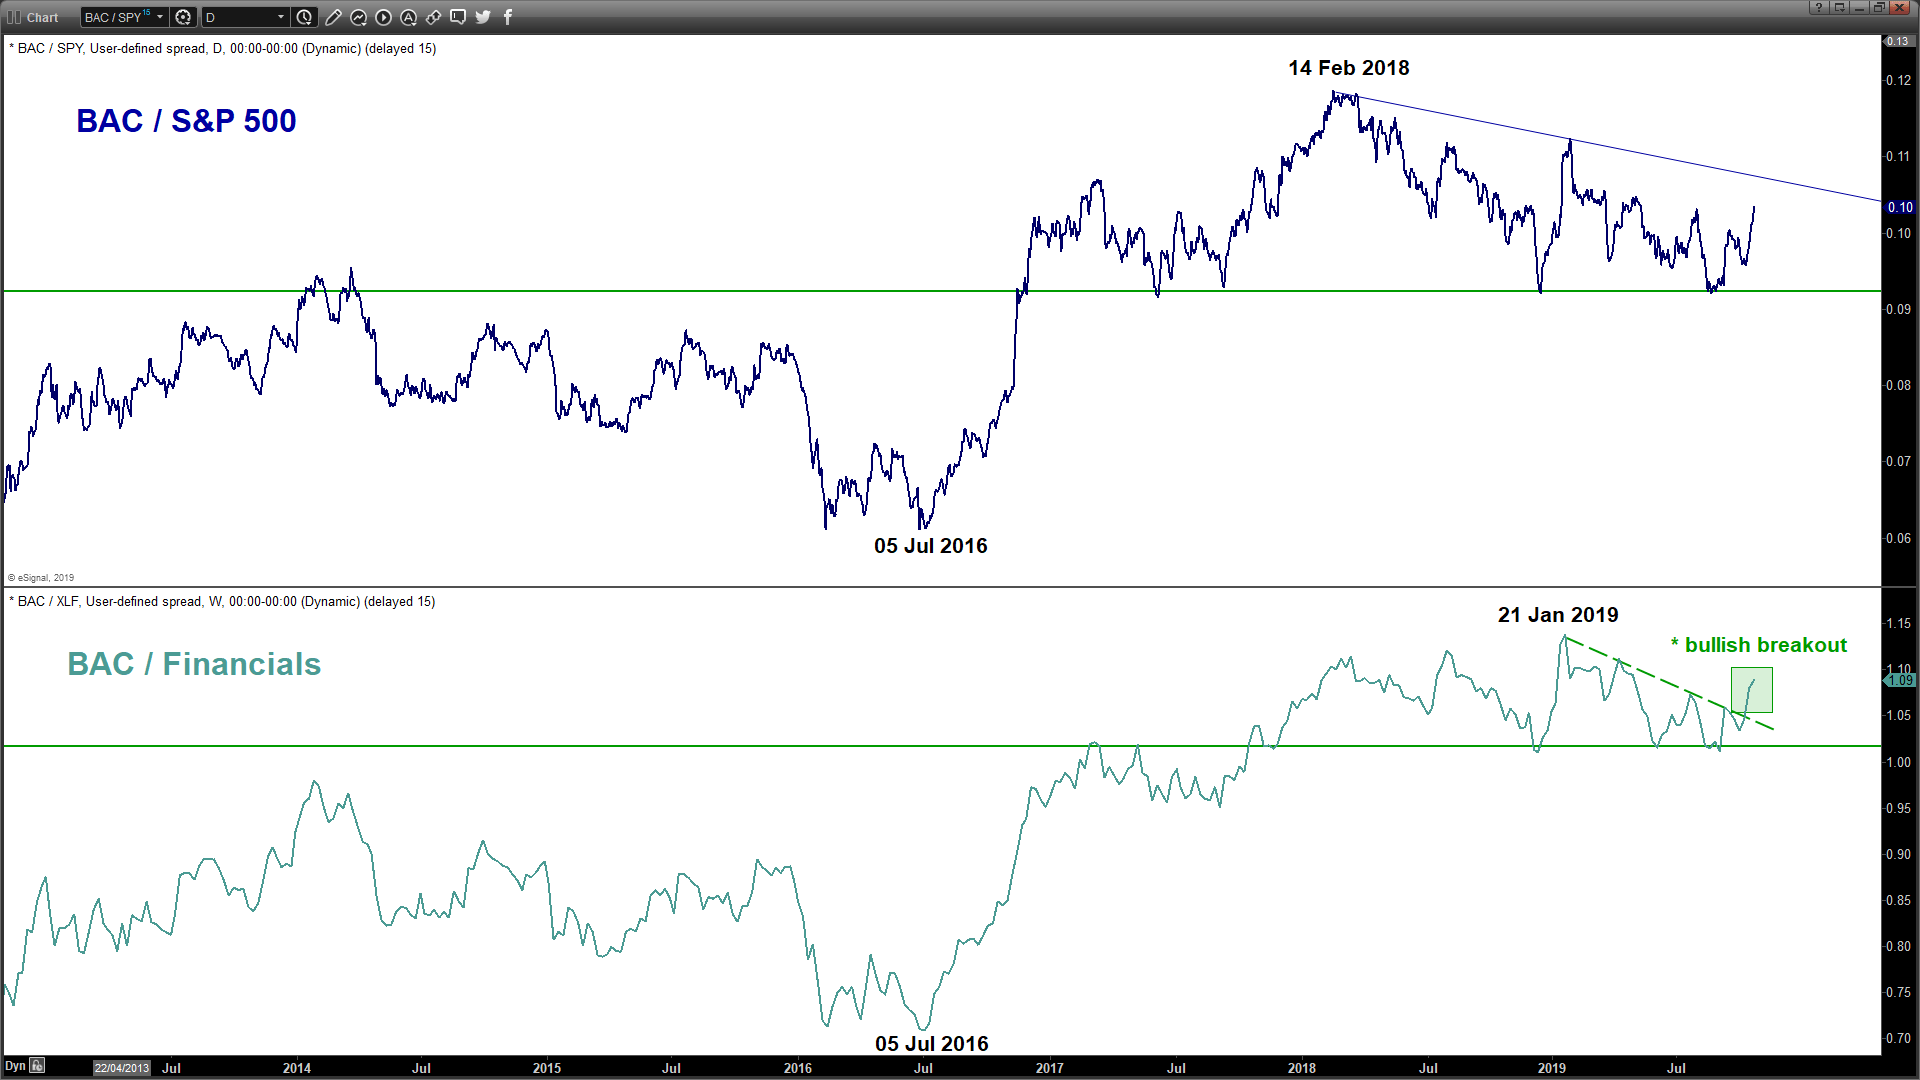
- Relative strength analysis against sector (Financials) as seen from its ratio chart is suggesting further potential outperformance of BAC
Charts are from eSignal
Latest market news
Latest Bank Stocks articles
October 10, 2023 09:31 AM
October 6, 2023 02:28 PM
July 17, 2023 04:03 PM
July 11, 2023 02:28 PM