


January 22, 2021 11:36 AM
Bad data, possibility of canceling Olympics pushing USD/JPY higher. Can it continue into fiscal year-end?
The news was not good for Japan this week. First, Japan extended its state of emergency due to the coronavirus to 5 more Prefectures. In addition, the Bank of Japan downgraded their forecast for near-term growth. Inflation and PMI data released today were both horrific. There is even talk that the Tokyo Olympics this summer will be outright canceled, not just postponed. The negative news is weakening the Yen vs the US Dollar. Can this move continue?
On a weekly timeframe, USD/JPY put in a high of 125.68 in June of 2015 and has been trending lower since. The downward sloping trendline off that high comes in now at near 109.25 and moves lower each week.
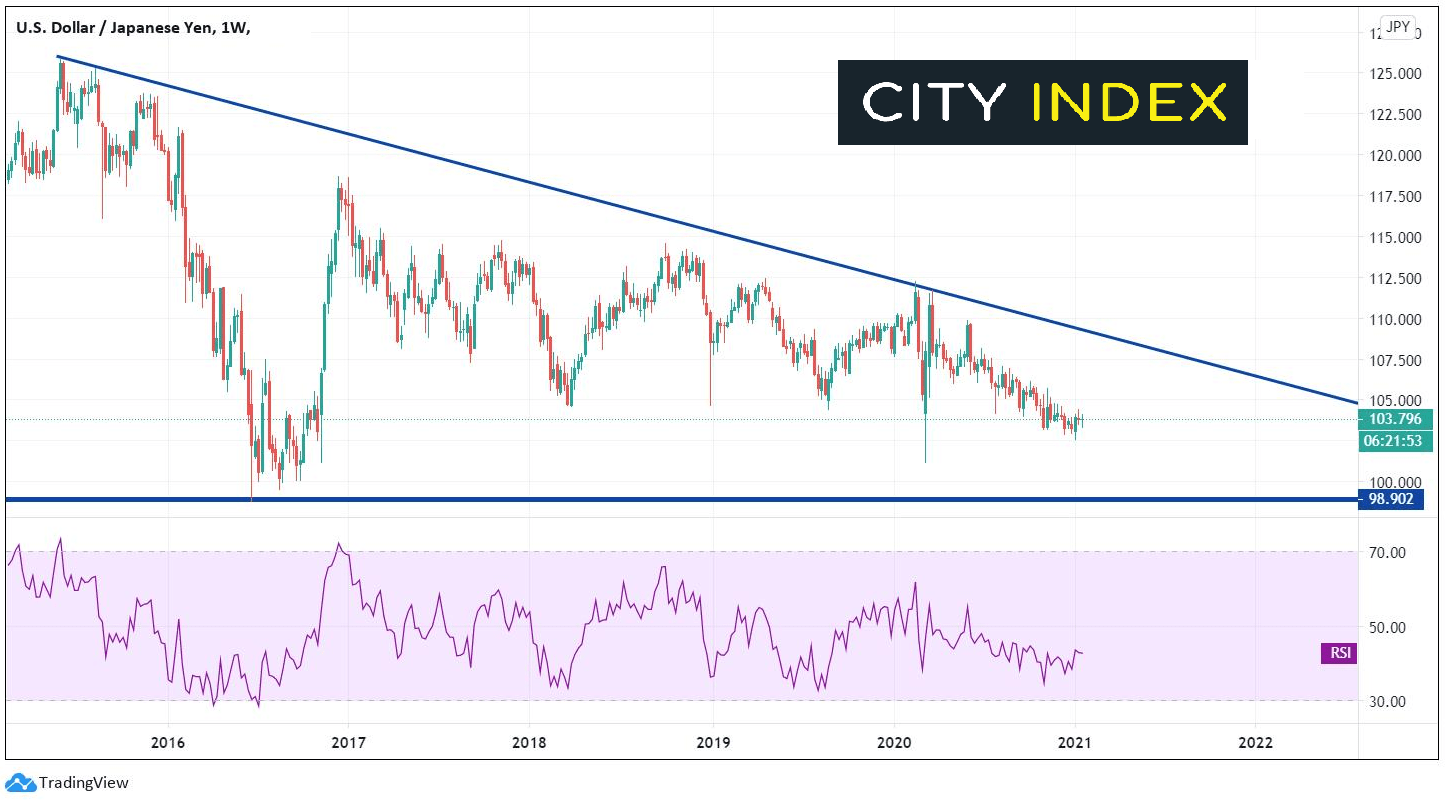
Source: Tradingview, City Index
On a daily timeframe, the chart shows the extremely volatility that took place in USD/JPY between mid-February and mid-March during the early part of the pandemic, in which price moved from 112.22 down to 101.18 and back to 111.71! The pair has continued lower in an orderly fashion, and as of July 2020, is in the process of forming a descending wedge. The top downward sloping trendline of the wedge is near 104.50, which is also the 61.8% Fibonacci retracement from the highs of November 11th, 2020 to the lows of January 6th. The bottom trendline of the wedge crosses near 102.34, just below the January 6th lows of 102.59.
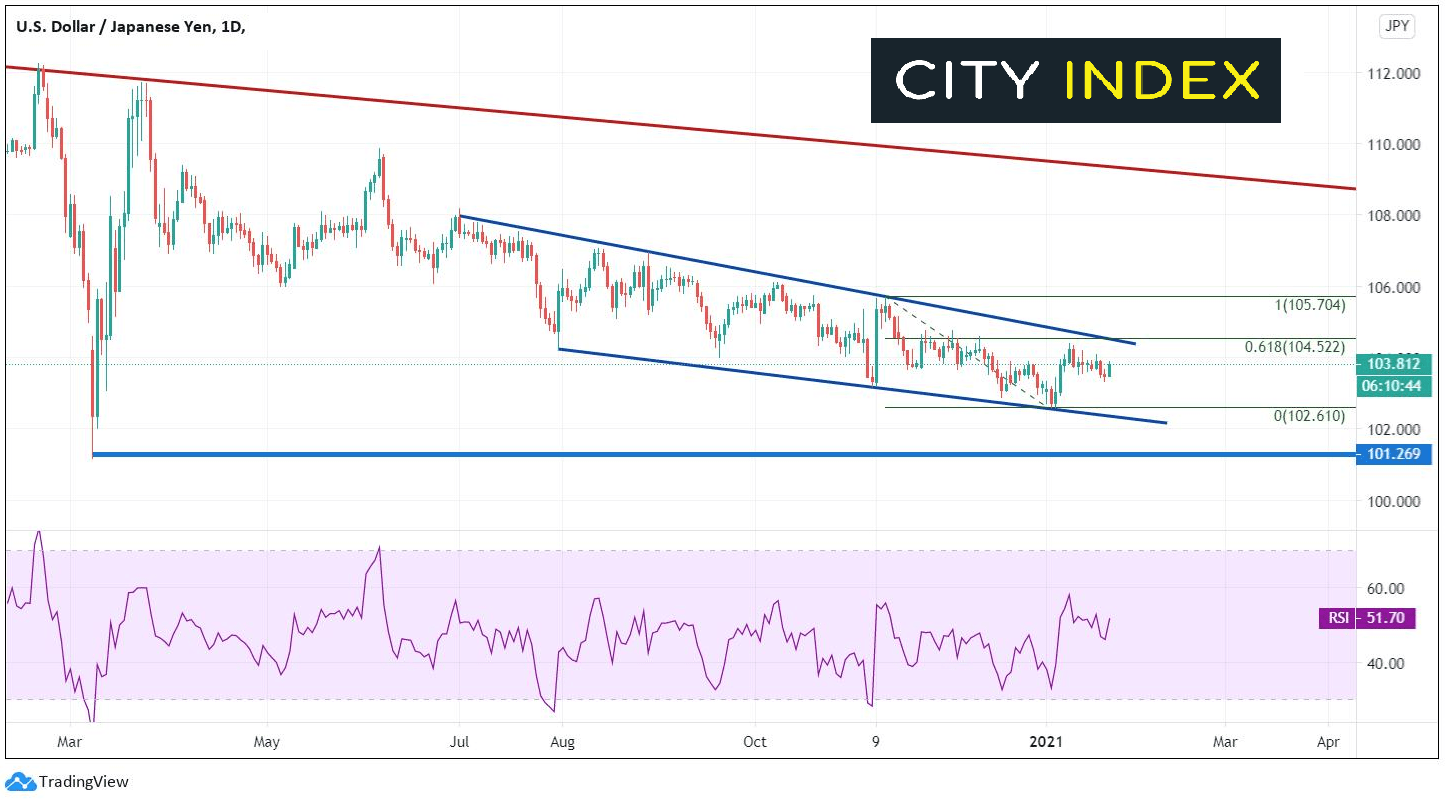
Source: Tradingview, City Index
Where to next? On a 240-minute timeframe, since November 6th, USD/JPY had been forming a descending wedge (within the daily descending wedge), and broke higher out of the wedge on January 6th. After the breakout, the pair pulled back to test the top trendline of the breakout (as so often does). In doing so, USD/JPY pulled back to the 61.8% Fibonacci retracement level from the January 6th lows to the January 11th highs near 103.30, forming a potential flag pattern (red). The pair appears ready to break higher out of the flag pattern and make its way towards the target, near 105.00. A break below 103.30 would invalidate the flag patten and open the door for a move back down to 102.59. Horizontal resistance ahead of the 105 target is near 104.38 and 104.77 (as well as the downward sloping trendline on the daily timeframe near 104.50).
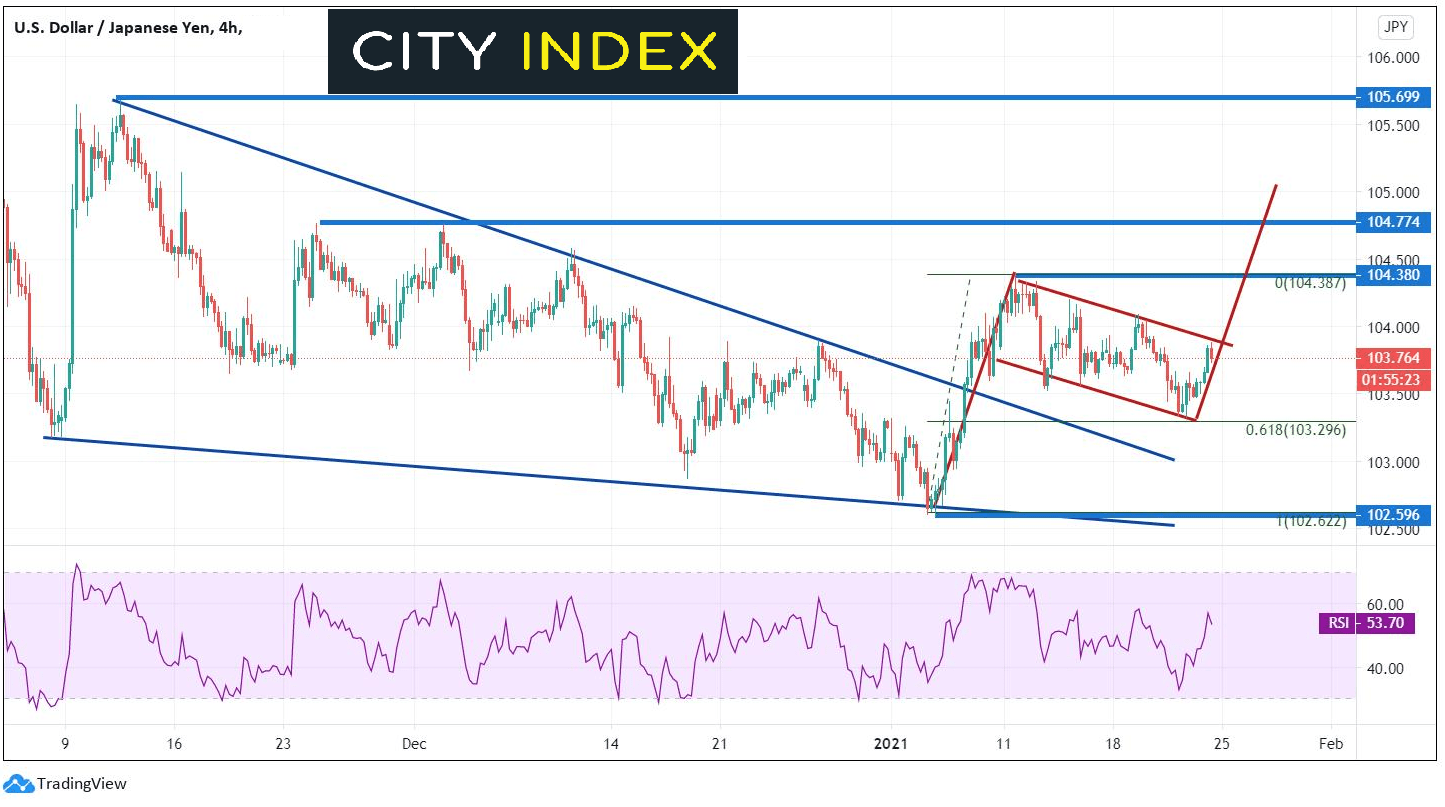
Source: Tradingview, City Index
USD/JPY has already broken above the downward sloping trending on the 240-minute timeframe. If price reaches the flag target near 105, it will also have broken through the downward sloping trendline on the daily timeframe. As mentioned, the downward sloping trendline on the weekly timeframe crosses near 109.25 and moves lower each week. USD/JPY bulls will be looking to buy dips to push price to that level!
Remember this as well: the fiscal year-end for Japan is March 31st. Japanese domiciled companies want a weaker Yen to repatriate funds from abroad at a cheaper price. The BOJ has been known to intervene in the fx markets in the past to weaken the Yen into year-end. Watch for possible intervention over the next few months, especially in USD/JPY moves lower.
Learn more about forex trading opportunities.
Latest market news
Today 01:15 PM
Today 11:30 AM
Today 08:18 AM
Latest Forex articles


Yesterday 11:30 AM
Yesterday 03:42 AM