Australian Dollar vs US Dollar Upside Breakout Continues Month Long Bullish
AUD/USD (daily chart) as of November 7, 2012, has broken out above key 1.0400 resistance, establishing a new six-week high in the process. This occurs within […]
AUD/USD (daily chart) as of November 7, 2012, has broken out above key 1.0400 resistance, establishing a new six-week high in the process. This occurs within […]
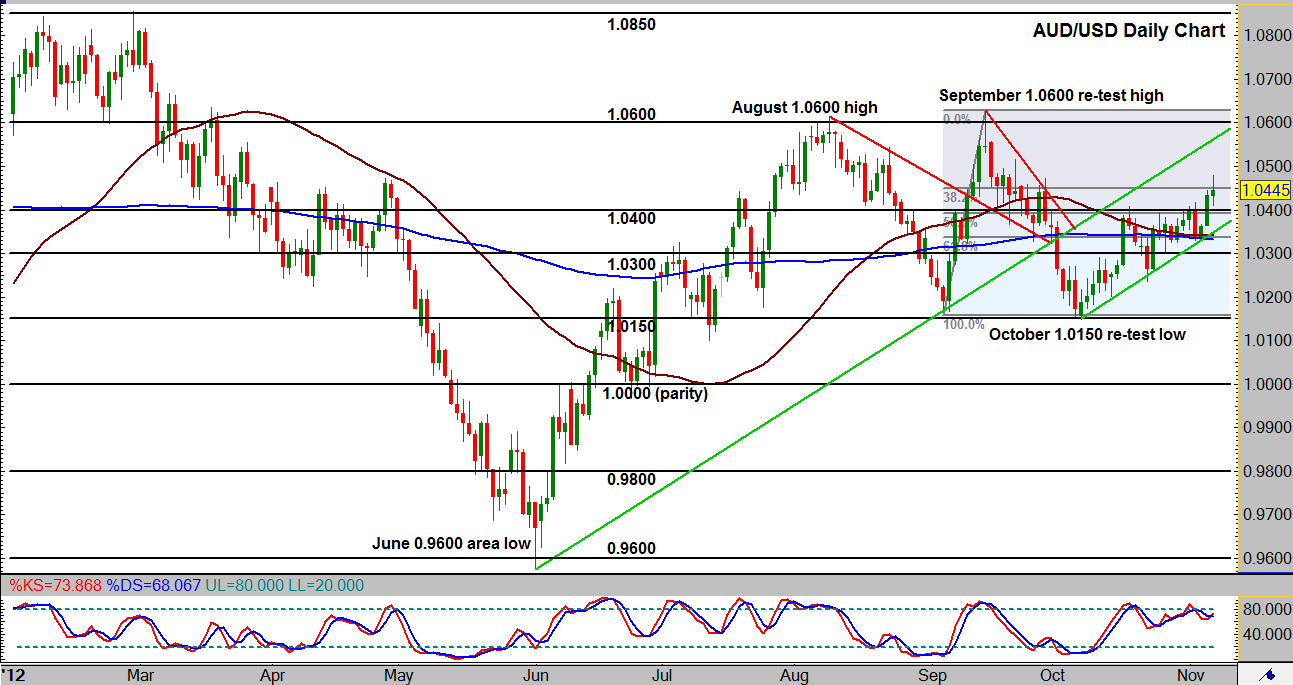
AUD/USD (daily chart) as of November 7, 2012, has broken out above key 1.0400 resistance, establishing a new six-week high in the process. This occurs within the context of a month-long bullish trend extending back to the early October re-test of the important 1.0150 support level. This also occurs within the context of a four-month sideways trading range, where the price has been bound strongly by 1.0150 support to the downside and 1.0600 resistance to the upside.
Now that AUD/USD has tentatively broken out above 1.0400 prior resistance, after having made failed attempts to do so for the last three weeks, price action could be looking to fulfil the upper half of the trading range with another potential re-test of the 1.0600 range high, provided the price is able to stay above this 1.0400 level.
A move back down below 1.0400 that goes on to break down below the month-long bullish trend line could be the downside trigger for a potential bearish re-test of the 1.0150 range low.