Australian Dollar vs US Dollar Entrenched in Bullish Trend
AUD/USD (daily chart) as of December 11, 2012 has continued its bullish run that has been in place since the 1.0150 area low was re-tested […]
AUD/USD (daily chart) as of December 11, 2012 has continued its bullish run that has been in place since the 1.0150 area low was re-tested […]
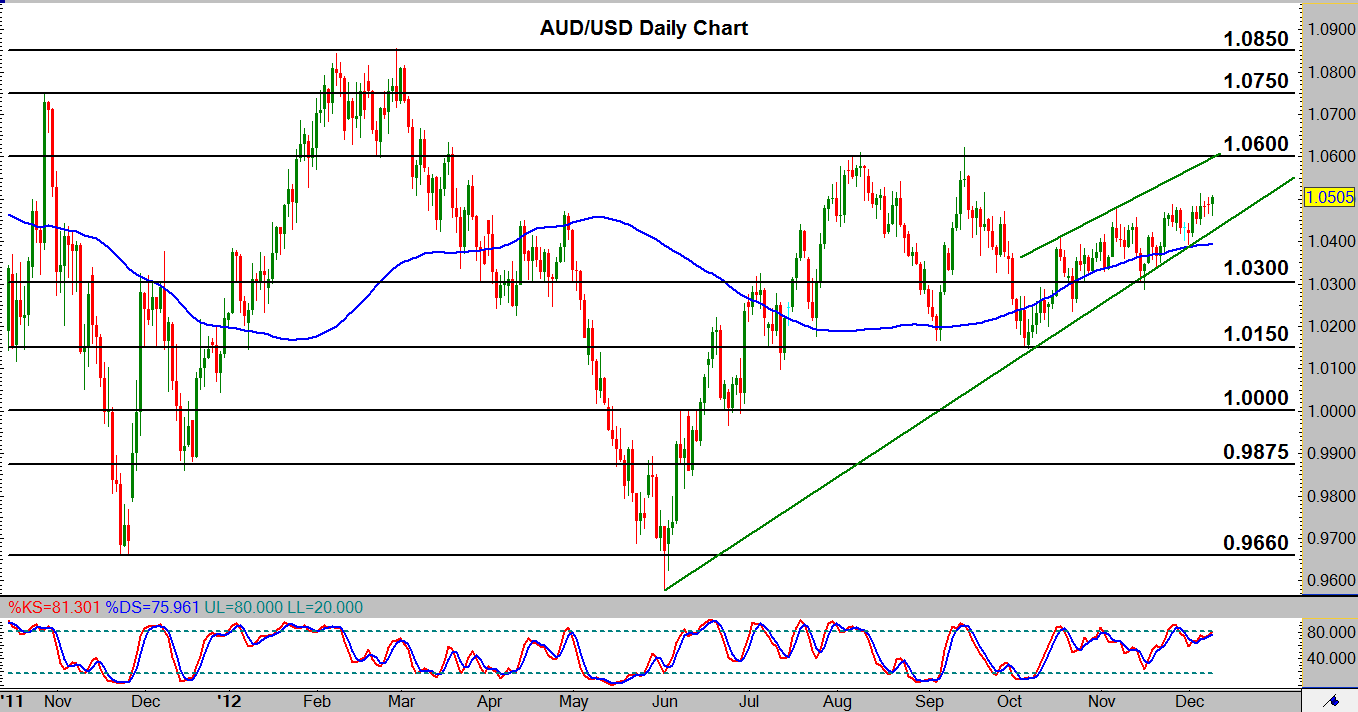
AUD/USD (daily chart) as of December 11, 2012 has continued its bullish run that has been in place since the 1.0150 area low was re-tested in early October. This bullish mini-trend occurs after price established resistance around 1.0600 in early August, then established 1.0150 area support in early September, then re-tested 1.0600 resistance in mid-September with a shooting star candle pattern, and finally re-tested 1.0150 support in early October. After the latest bearish correction down to 1.0150 in early October, price began the current bullish trend that is outlined by a rough rising wedge pattern. Rising wedges can be considered potential bearish patterns if there is a downside pattern break. If this occurs, the key 1.0300 level could once again serve as potential intermediate support on a substantial downside move. The overall trend for AUD/USD, however, is bullish from the June lows. A key level to watch in the event of continued upside trend momentum would be the 1.0600 level. In the event of a strong breakout above that level, which could confirm an uptrend continuation, price could move towards re-tests of further potential upside resistance around the 1.0750 and 1.0850 levels.