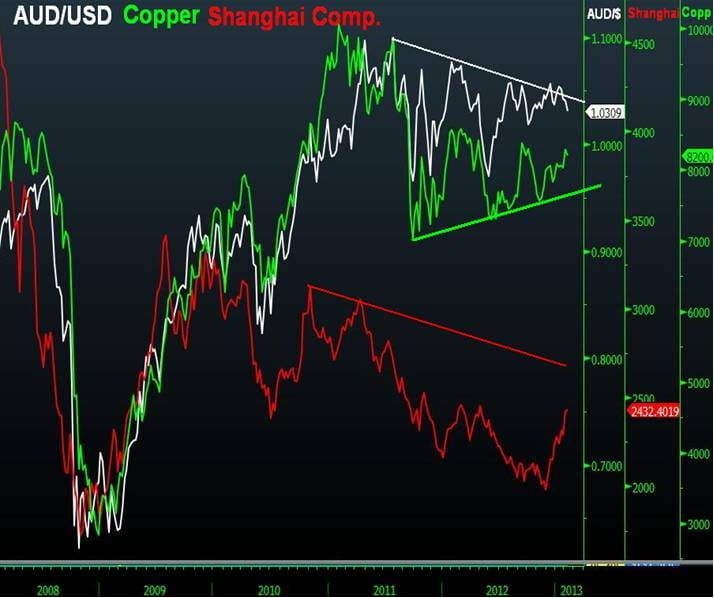
Aussie vs Copper vs Shanghai Composite
As the improvement in China’s economic data further allays fears of a hard landing and copper prices disprove fears of a head-&-shoulder formation, will the […]
As the improvement in China’s economic data further allays fears of a hard landing and copper prices disprove fears of a head-&-shoulder formation, will the […]
As the improvement in China’s economic data further allays fears of a hard landing and copper prices disprove fears of a head-&-shoulder formation, will the Australian currency too show its part resilience?
Copper has risen 11% from its November lows but fared as the weakest of metals in 2012 to return less than 5%. Chartists have had an eye on the evolving head-&-shoulder formation extending from 2009, with a left shoulder in April 2010, a head in Feb-July 2011 and a distributing right shoulder in most of 2012, which is not the cleanest of H&S formations. Assessing the dynamics in oscillators, however, we observe the potential for further ascent in momentum, driving prices above the $8410/tonne resistance, before extending towards 8,770. A successful break would then face the next barrier at 8920. Support is seen firmly in place since end of 2008 at 8,020.
China’s Shanghai Composite index faces the confluence of the 55 and 100 SMAs on the monthly chart at 2,540, followed by the 2009 trendline resistance at 2,600. Posting eight rising weeks out of the last 10 indicates upcoming consolidation above 2,360, before the next phase of momentum pickup take holds. Anecdotal reports of a rise in brokerage accounts for individual Chinese investors are also propping up sentiment.
AUD/USD has come under severe pressure over the past two weeks, despite the RBA’s decision to hold rates unchanged. The third straight monthly decline in Aussie retail sales (longest negative pace in over 10 years) and the third monthly net loss in full-time employment (longest declining streak in four years) open the door for expecting further easing even if the RBA maintains a dovish tone without pulling the trigger. The simultaneous break below the 55 and 10 WMAs in a single week raise questions about a possible print at 1.02, with increased resistance at 1.0500.
The divergence between copper and Shanghai composite on one side and the AUD/USD pair on another may be seen into the rest of the month until consolidation in the pair transitions to a gradual recovery towards 1.0700 in mid Q2.