Aussie profit taking ahead of year end: AUD/USD, AUD/JPY
After a large move in the Australian Dollar this year, it may be time to take some profits ahead of year end. Markets could be very slow this week, barring any headline risk. However, with less participation in the markets due to the year end holidays, any moves that we do see have the possibility to be exaggerated, especially as we get closer to December 31st. If one is concerned about such volatility, he or she may want to consider taking some profits in Aussie before year end.
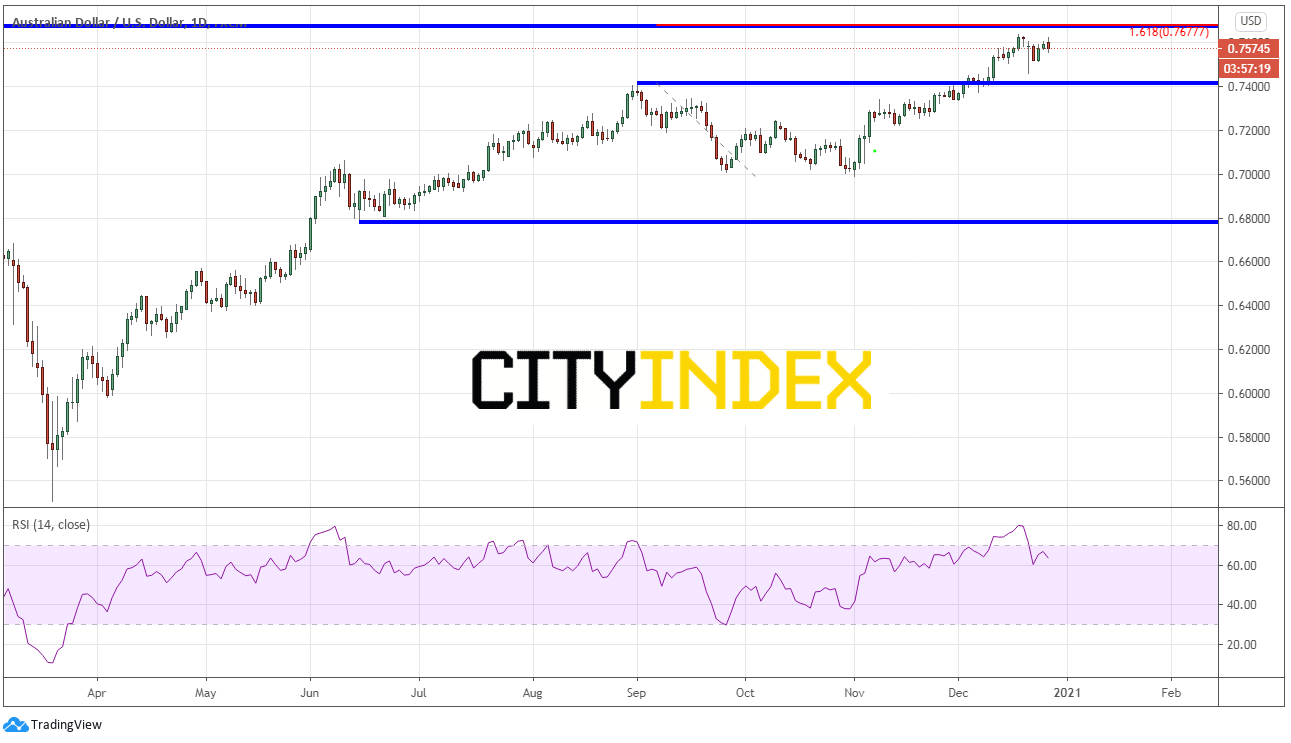
On March 19th, AUD/USD put in a low near 0.5506 and hasn’t looked back since. The pair reached a high of 0.7639 on December 17th and had pulled back slightly to 0.7461 before bouncing again to current levels near 0.7570. If traders who are long AUD/USD are worried about year-end risk, current levels may be a place to take some profits.
A daily chart shows that the pair is nearing resistance at the December 17th highs, as well as horizontal resistance just above from June 2018 near 0.7677. That same level also coincides with the 161.8% Fibonacci extension from the highs of September 1st to the lows of November 2nd.

Source: Tradingview, City Index
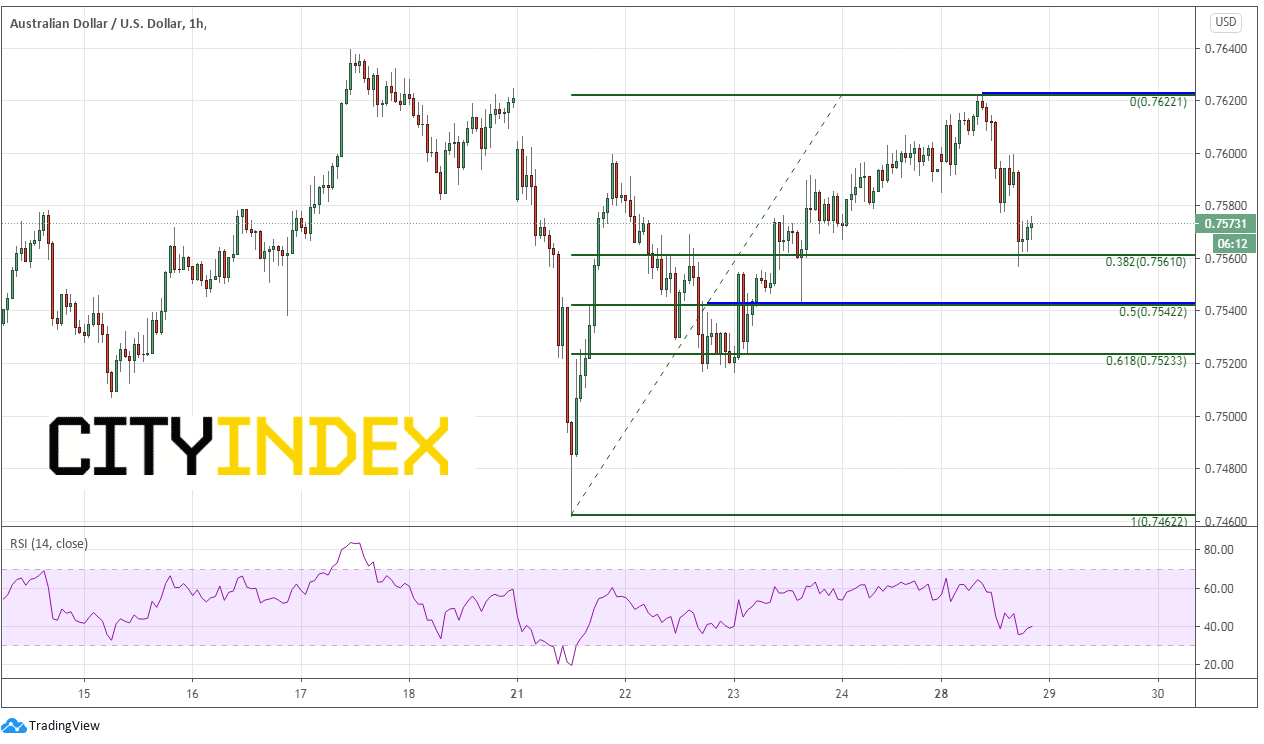
On a 60-minute timeframe, AUD/USD could not take out the highs of December 17th near 0.7640 and has pulled back to the 38.2% Fibonacci retracement from the lows of December 21st to todays highs, near 0.7561. Watch for bounces to 0.7580/0.7600 to be sold. Additional support below at horizontal support and the 50% retracement level from the same timeframe is near 0.7523. The 61.8% Fibonacci retracement level comes in near 0.7523.

Source: Tradingview, City Index
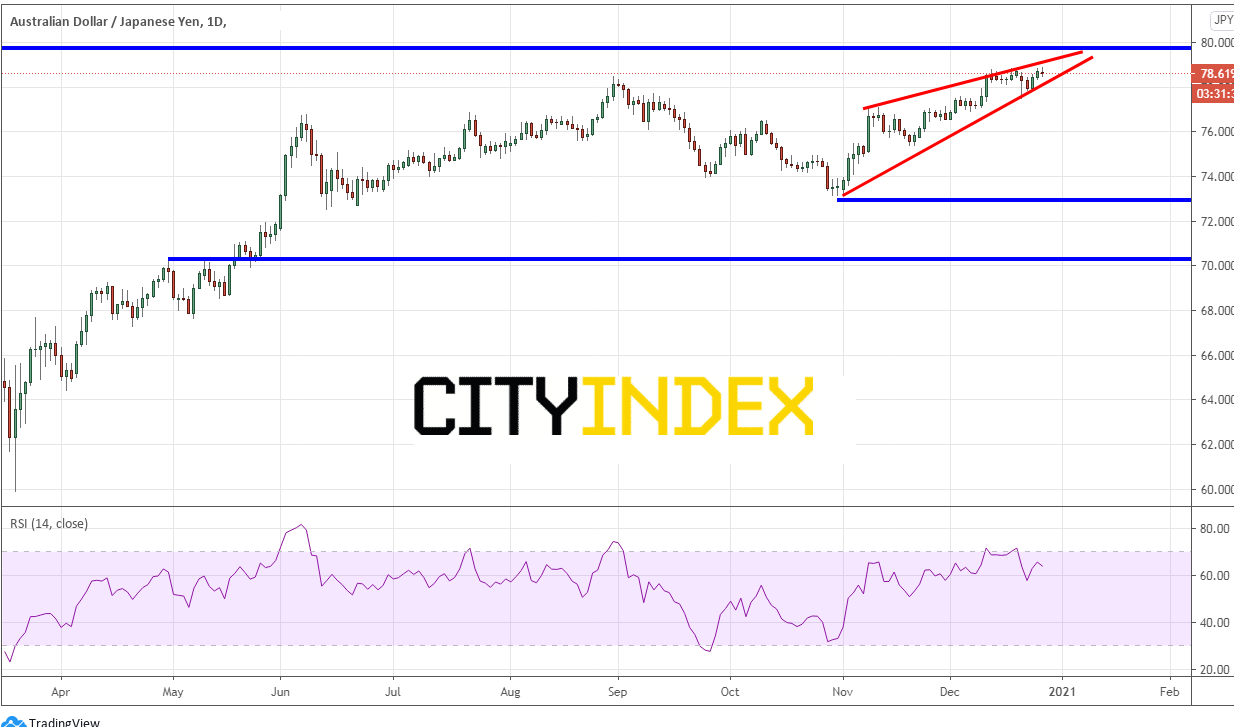
AUD/JPY has been moving in a similar pattern as AUD/USD since putting in lows on March 19th near 59.89. The pair rallied to new yearly highs today of 78.88. Since November 2nd, price has been rising in an ascending wedge pattern and is nearing the apex. If price breaks lower, the target for an ascending wedge is a 100% retracement of the wedge, which in this case is near 73.13. Long term resistance is above near 80.00.

Source: Tradingview, City Index
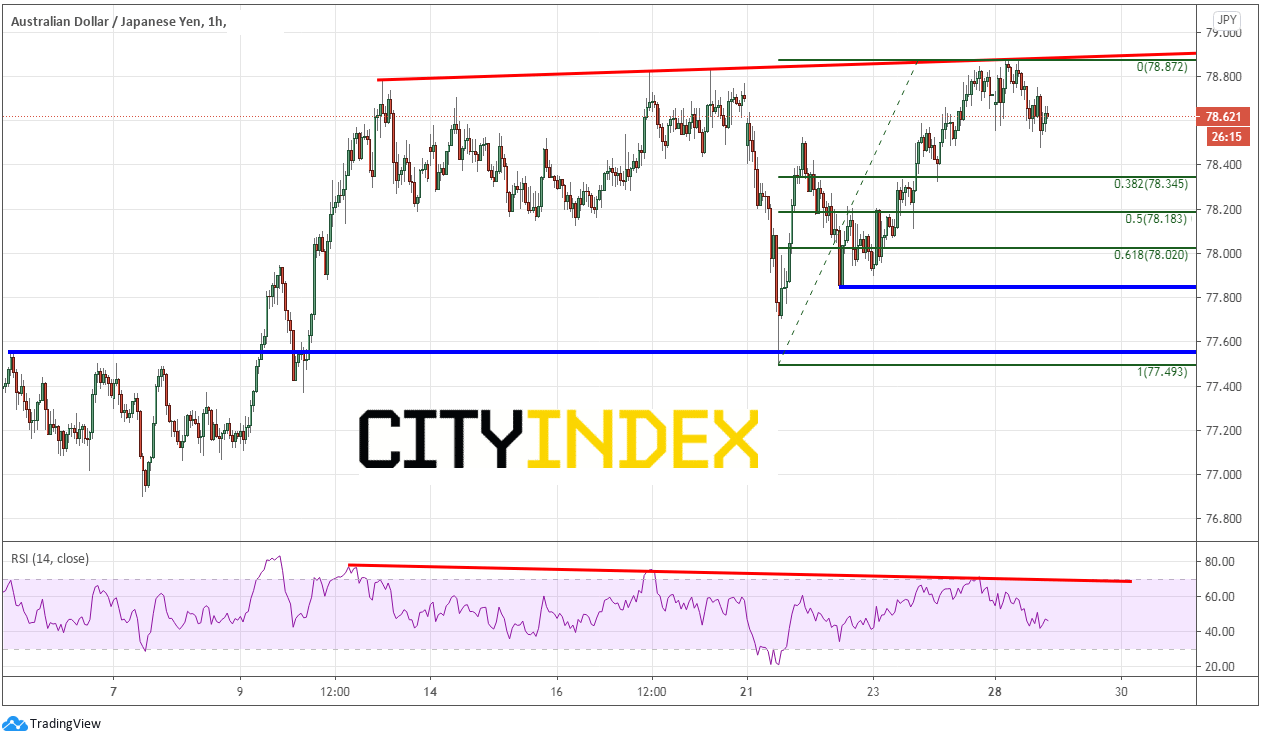
On a 60-minute timeframe, price has put in 3 higher highs while the RSI has put in 3 lower highs. This is an indication of a potential reversal in price. If price does move lower, support is at the 38.2% Fibonacci retracement level near 78.34, the 50% retracement level near 78.18 and the 61.8% Fibonacci retracement level near 78.02.

Source: Tradingview, City Index
If traders are concerned about year-end headline risk and are comfortably in the money on some Aussie pairs, current levels offer a nice reward if one is long from levels much lower!
Learn more about forex trading opportunities.


