AUD USD weighed down and approaching key support
AUD/USD (daily chart shown below) has continued to be weighed down recently within the sideways trading range that the currency pair has been fluctuating within […]
AUD/USD (daily chart shown below) has continued to be weighed down recently within the sideways trading range that the currency pair has been fluctuating within […]
AUD/USD (daily chart shown below) has continued to be weighed down recently within the sideways trading range that the currency pair has been fluctuating within for the past four months.
The beginning of July saw a new 2014 high just above 0.9500 but price action has been unable to re-test that high for the past month-and-a-half as the pair has continued to drift to the downside since then.
Now trading squarely between its two major moving averages - the 50-day and 200-day – AUD/USD appears poised for a downside re-test of the key 0.9200 support level, an area that has held strongly since early April.
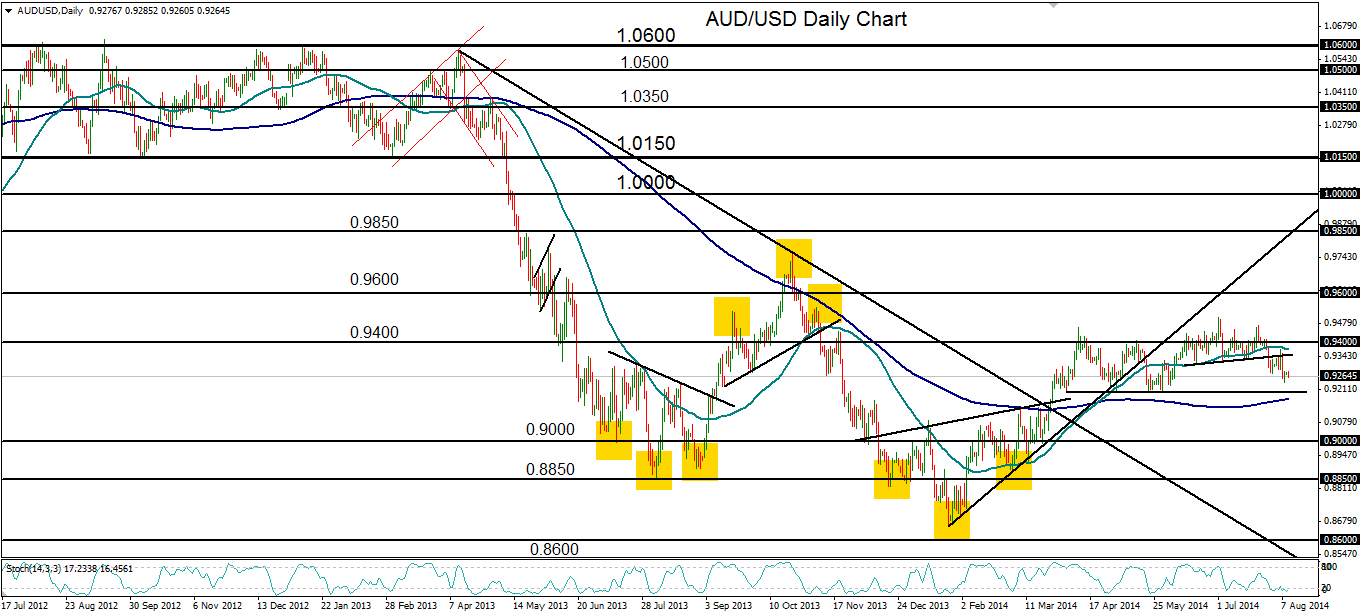
If the 0.9200 level continues to hold, any rebound from around that support area should continue the prolonged trading range, with an upside resistance target residing once again around the noted 0.9500 level.
Any strong breakdown below 0.9200 support and the 200-day moving average would place this year’s bullish recovery trend in serious jeopardy, with a major downside target around the 0.9000 psychological support level.
