AUD USD range trading near lows
AUD/USD (daily chart shown below) has continued to trade within a moderate range between its two key moving averages – the 50-day and 200-day – […]
AUD/USD (daily chart shown below) has continued to trade within a moderate range between its two key moving averages – the 50-day and 200-day – […]
AUD/USD (daily chart shown below) has continued to trade within a moderate range between its two key moving averages – the 50-day and 200-day – for more than a month.
This consolidation phase occurs within a strong bearish trend that extends back to the April 2013 high near 1.0600, which continues to remain intact.
Within this bearish trend, the currency pair has rebounded from a three-and-a-half-year low of 0.8659 that was hit in January, but has been unable as of yet to follow-through significantly on this rebound.
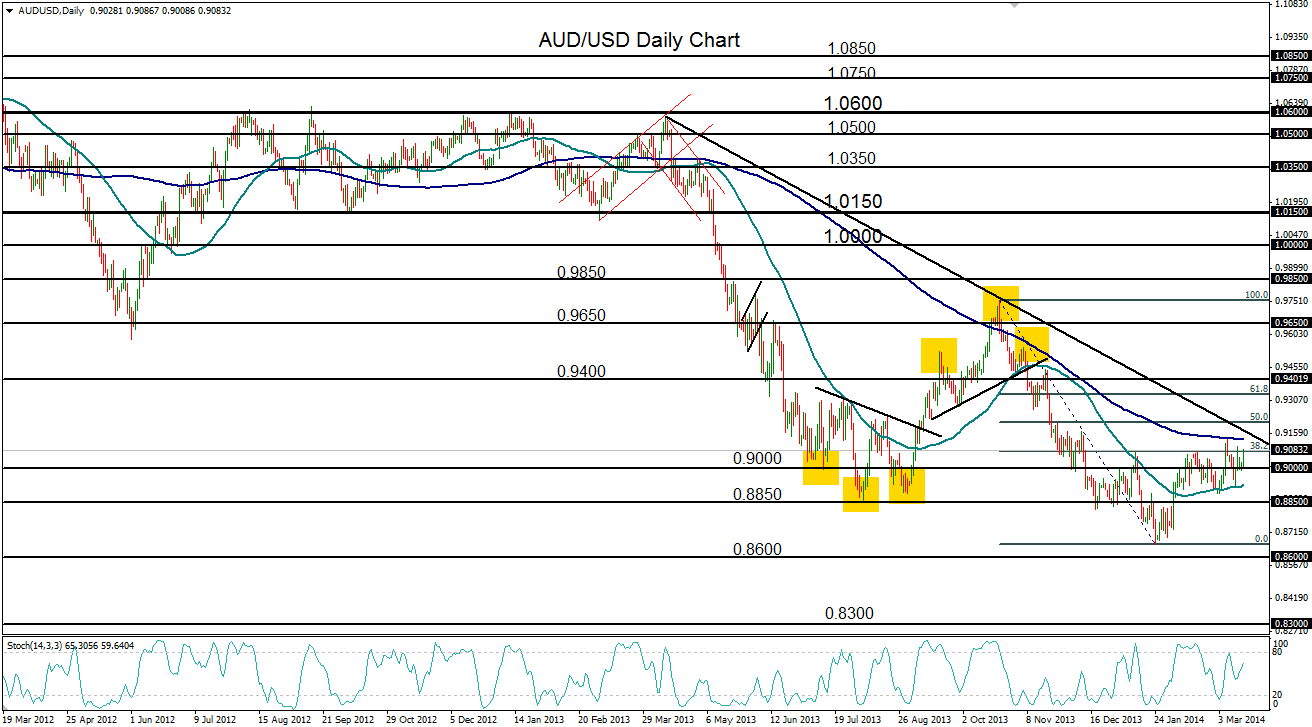
The 200-day moving average to the upside is currently serving as strong resistance, and has recently halted the pair’s further rise.
Also directly to the upside resides a major downtrend resistance line that connects the noted April high near 1.0600 with the October high at 0.9757.
With this confluence of strong resistance directly above current price action, AUD/USD could well be constrained in its attempts to advance.
If the pair continues to respect resistance with a move back to the downside below the noted 50-day moving average support, major targeted support levels further to the downside continue to reside around 0.8850 and then 0.8600.
