AUD USD pulls back within bullish trend
AUD/USD (daily chart shown below) has pulled back within the tentative uptrend that extends back to January’s long-term low of 0.8659. This new bullish trend […]
AUD/USD (daily chart shown below) has pulled back within the tentative uptrend that extends back to January’s long-term low of 0.8659. This new bullish trend […]
AUD/USD (daily chart shown below) has pulled back within the tentative uptrend that extends back to January’s long-term low of 0.8659.
This new bullish trend has been highlighted by an inverted head-and-shoulders reversal pattern that has marked the potential bottoming-out of the downtrend that has been securely in place since the 1.0600-area highs a year ago.
After the head-and-shoulders reversal pattern formed, the currency pair broke out above the pattern’s neckline and the 200-day moving average in late March, hitting the 0.9400 resistance target by mid-April.
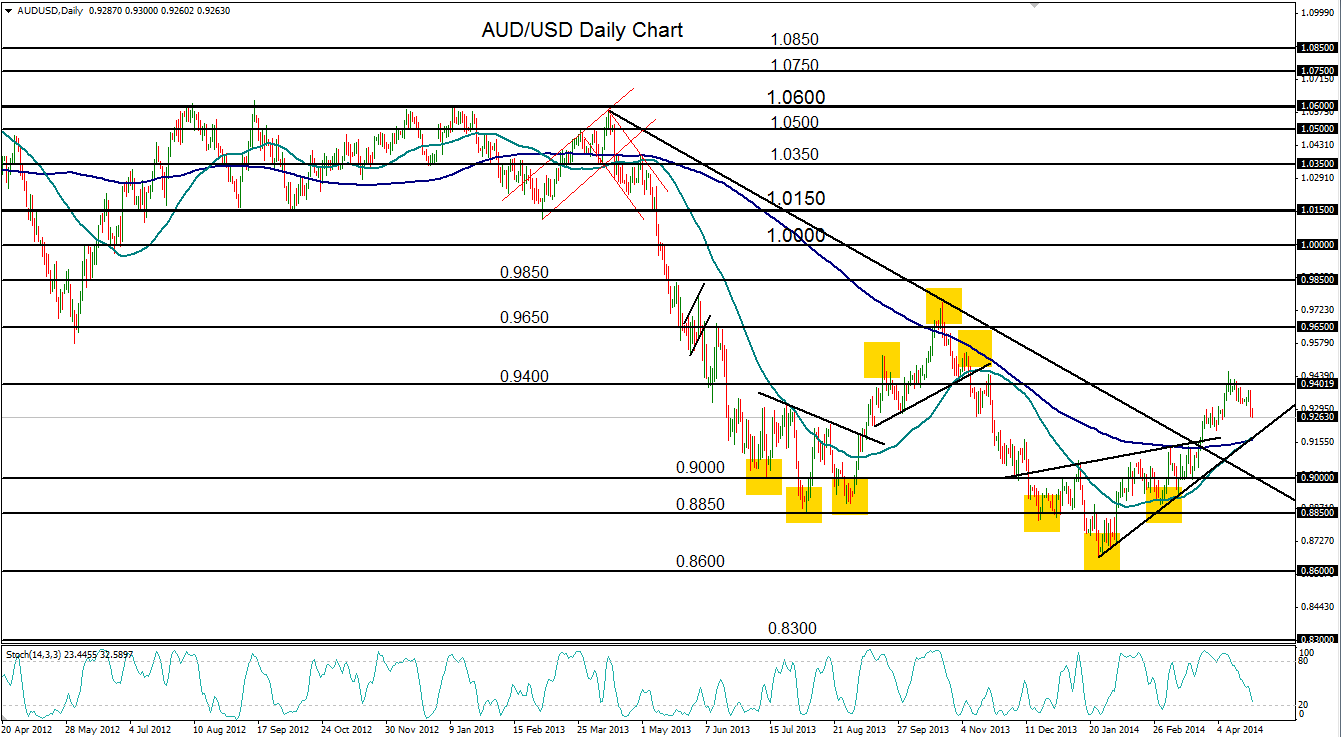
Although it has risen significantly in the past three months, AUD/USD has not yet been able to reach its head-and-shoulders price target around the 0.9600 level before this most recent pullback in the past two weeks.
Despite this pullback, the pair is still above the new uptrend support line that extends back to the noted January 0.8659 long-term low.
A resumption of the current uptrend should once again move the pair towards its 0.9600 pattern target.
To the downside, any support breakdown of the new uptrend line and the 200-day moving average should find strong further support to the downside around the key 0.9000 psychological level.
