AUD USD pressured to the downside
AUD/USD (daily chart shown below) has been unable to regain much of its lost ground after having fallen from 0.9400-area resistance in mid-May. That drop […]
AUD/USD (daily chart shown below) has been unable to regain much of its lost ground after having fallen from 0.9400-area resistance in mid-May. That drop […]
AUD/USD (daily chart shown below) has been unable to regain much of its lost ground after having fallen from 0.9400-area resistance in mid-May.
That drop broke down below both a clear uptrend support line extending back to January’s three-and-a-half year low of 0.8659, as well as the 50-day moving average.
The currency pair then fell to major support around the 0.9200 area, which has strongly supported AUD/USD on numerous occasions for over two months.
Last week saw a brief rise that was unable to follow-through after hitting dynamic resistance around the 50-day moving average.
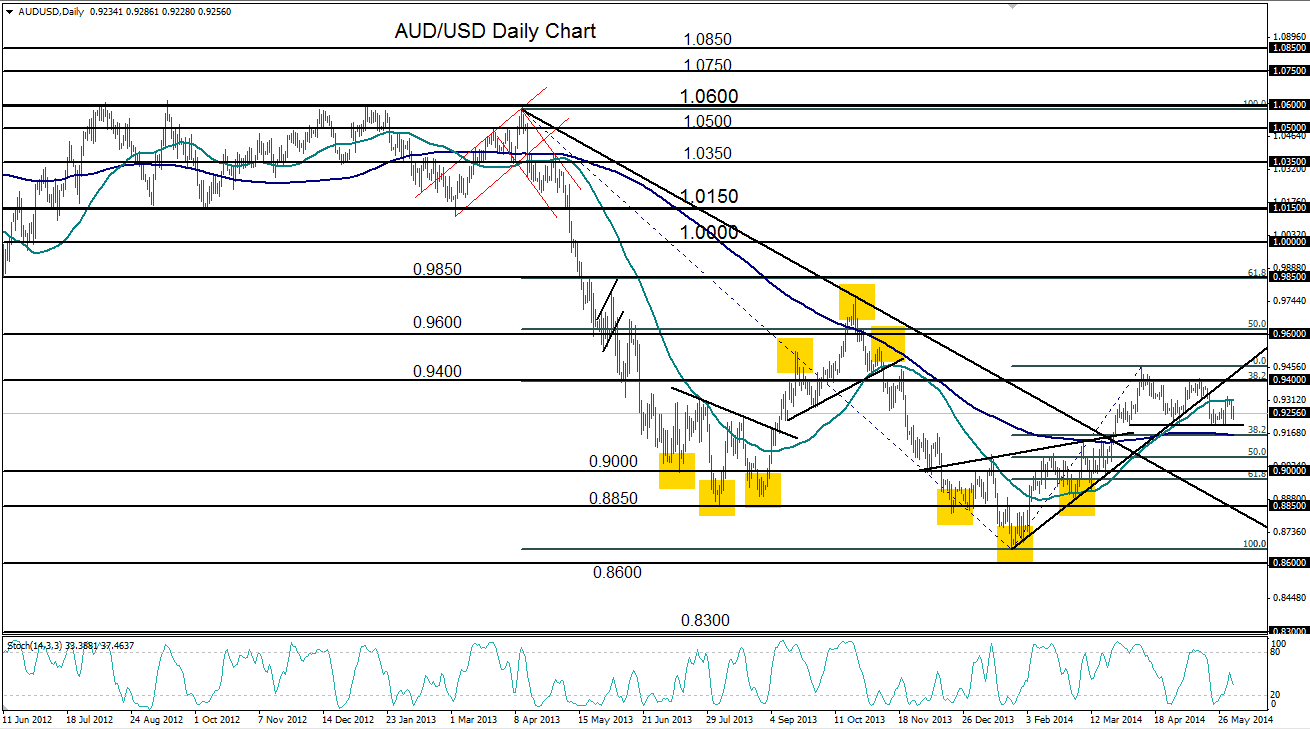
As the pair is currently entrenched in a rather tight consolidation, the key support and resistance levels to watch are relatively close by.
To the downside is the noted 0.9200 level. If price action is able to breakdown below this major support level, slightly to the downside resides both the 200-day moving average as well as the 38% Fibonacci level of the recent rise from January’s 0.8659 low up to April’s 0.9460 high.
Any further breakdown below that support area should find a further downside target around the 0.9000 psychological level.
To the upside, any break above the 50-day moving average could clear the way for a rebound and continued recovery targeting the 0.9400 and 0.9600 levels once again.
