AUD USD Poised for Breakdown
June 25, 2015 – AUD/USD continues to trade near the lower end of a bearish flag pattern consolidation just off its long-term lows. The current […]
June 25, 2015 – AUD/USD continues to trade near the lower end of a bearish flag pattern consolidation just off its long-term lows. The current […]
June 25, 2015 – AUD/USD continues to trade near the lower end of a bearish flag pattern consolidation just off its long-term lows. The current chart formation hints at a potential impending continuation of the established downtrend on any breakdown of the pattern.
This slightly rising price pattern has formed over the past month after the currency pair plunged in the latter half of May to approach April’s five-year low of 0.7532.
During the course of this pattern unfolding, price action has managed consistently to close under the key 50-day moving average every trading day and return back to its lows after rebounds.
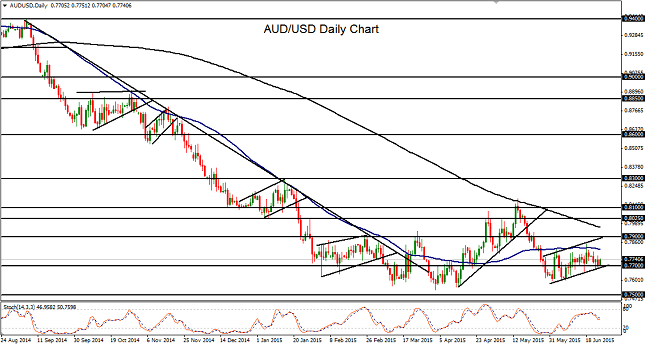
From a longer-term perspective, AUD/USD continues to trade within a sharp downtrend that has been in place for the past year, since the 0.9500-area intermediate high last July. The currency pair also continues to trade well below its long-term 200-day moving average.
Currently, short-term support is right around the 0.7700 level, which also closely coincides with the lower border of the inverted flag pattern. As AUD/USD continues to trade within this consolidation, the key technical event to watch for would be a potential breakdown below both this 0.7700 level and the flag’s lower border.
In the event of such a breakdown, downside support targets may be found at 0.7500, which would confirm a continuation of the long-term downtrend, and then the 0.7300 support level further to the downside.
