AUD USD long term bullish trend in sight
In days like today when the economic calendar is literally empty, it sometimes pays to sit on your hands and study the long-term charts in […]
In days like today when the economic calendar is literally empty, it sometimes pays to sit on your hands and study the long-term charts in […]
In days like today when the economic calendar is literally empty, it sometimes pays to sit on your hands and study the long-term charts in order to determine the direction of the long-term trends. On todays like today, the prices often stage nasty counter trend moves, driven by profit-taking and as market makers seek liquidity. The AUD/USD, for example, which has been trending lower in recent months managed to bounce back sharply today. Admittedly, the RBA’s last meeting minutes that were released overnight did not contain much in the way of new information, which may have been part of the reason why the AUD has bounced back. But the Australian central bank did however sound pessimistic about the economy and reiterated that further depreciation in AUD seemed both likely and necessary. In truth, today’s bounce in AUD/USD was mainly a US dollar move; the greenback fell victim to profit taking following its recent strong gains.
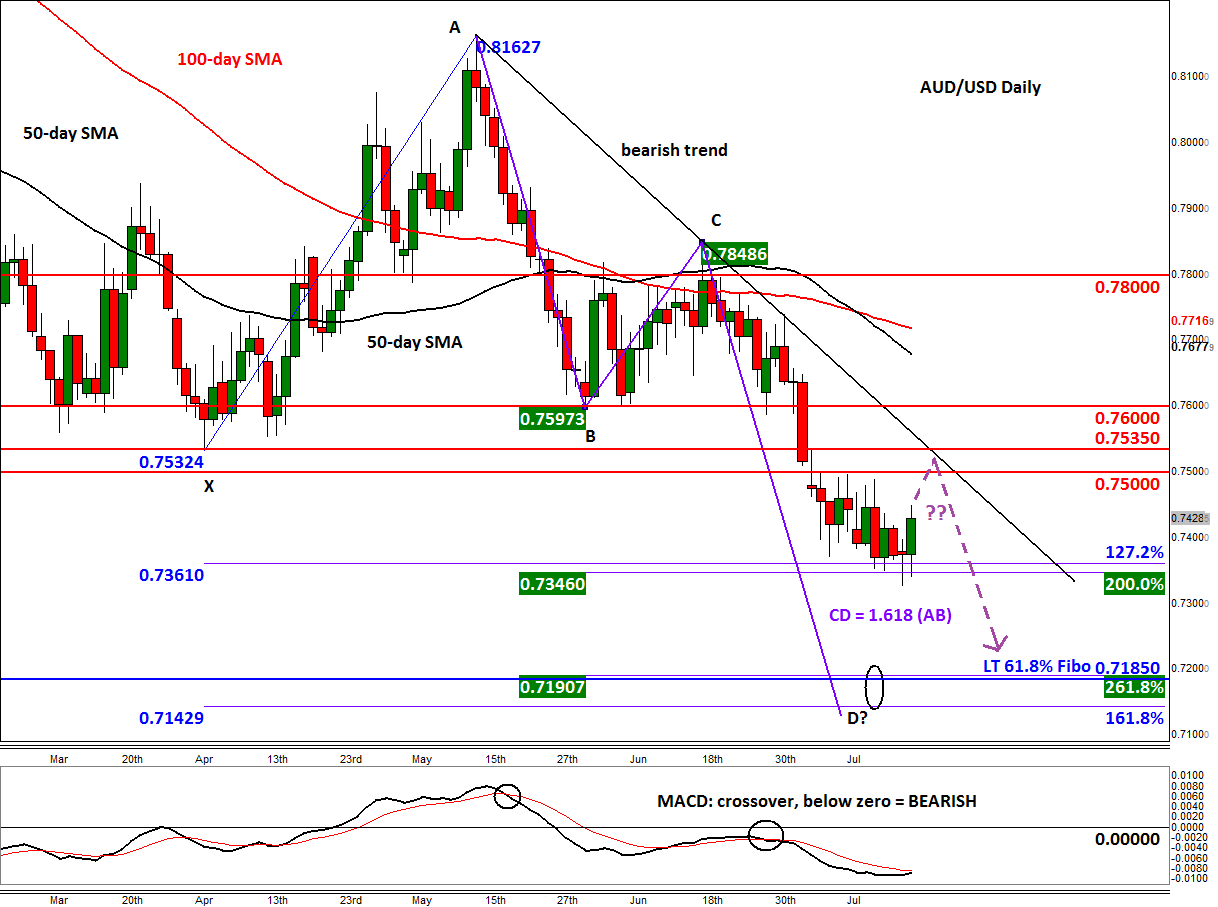
From a technical point of view, the AUD/USD’s bounce back looks logical in that price has found some support from a Fibonacci extension or exhaustion area which can be seen on the daily chart. From here, the Aussie could rise all the way back to the prior support-turned-resistance levels such as 0.7500 or 0.7535 before potentially heading south once again. It also faces a downward-sloping trend line around those levels, making it likely that price will indeed turn there.
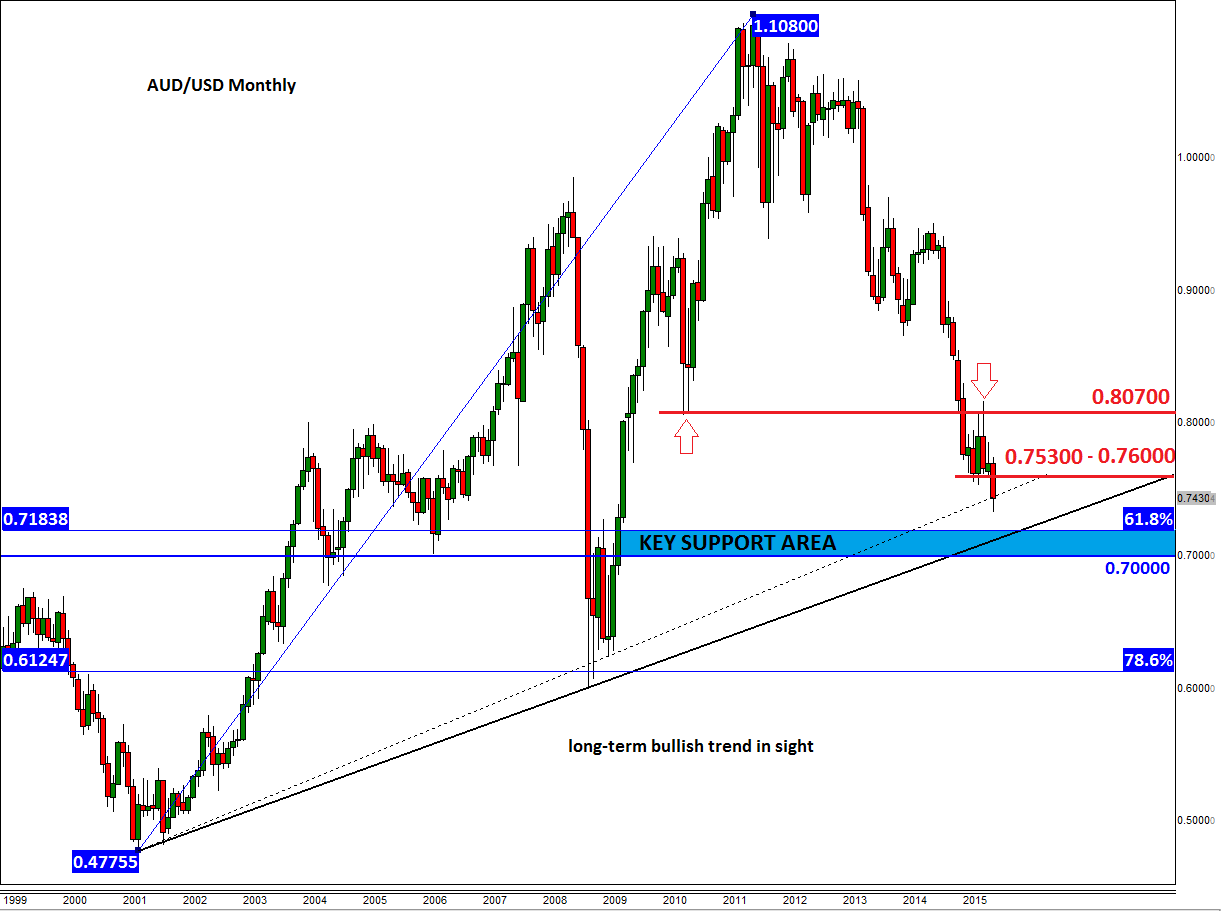
Meanwhile the key long-term Fibonacci-based support area around 0.7140-0.7190 is now not too far off. This area is where a couple of extension levels converge, including the 161.8% of XA and 261.8% of BC swings as shown on the on the daily chart. More importantly, here we also have the very long-term 61.8% retracement of the upswing from the 2001 low, at 0.7180/5. Significantly, this level comes in around the long-term bullish trend line, too. Thus, there is a possibility that rates may soon bottom out. Needless to say, a break below the long-term bullish trend line could be a major bearish development. So, while there is still room to the downside, there is also the possibility that we are approaching a near-term bottom.