AUD USD forecast for 2014
What can we expect from AUD/USD in the year to come? Looking back: AUD/USD price movements during 2013 The primary theme for AUD/USD (a […]
What can we expect from AUD/USD in the year to come? Looking back: AUD/USD price movements during 2013 The primary theme for AUD/USD (a […]
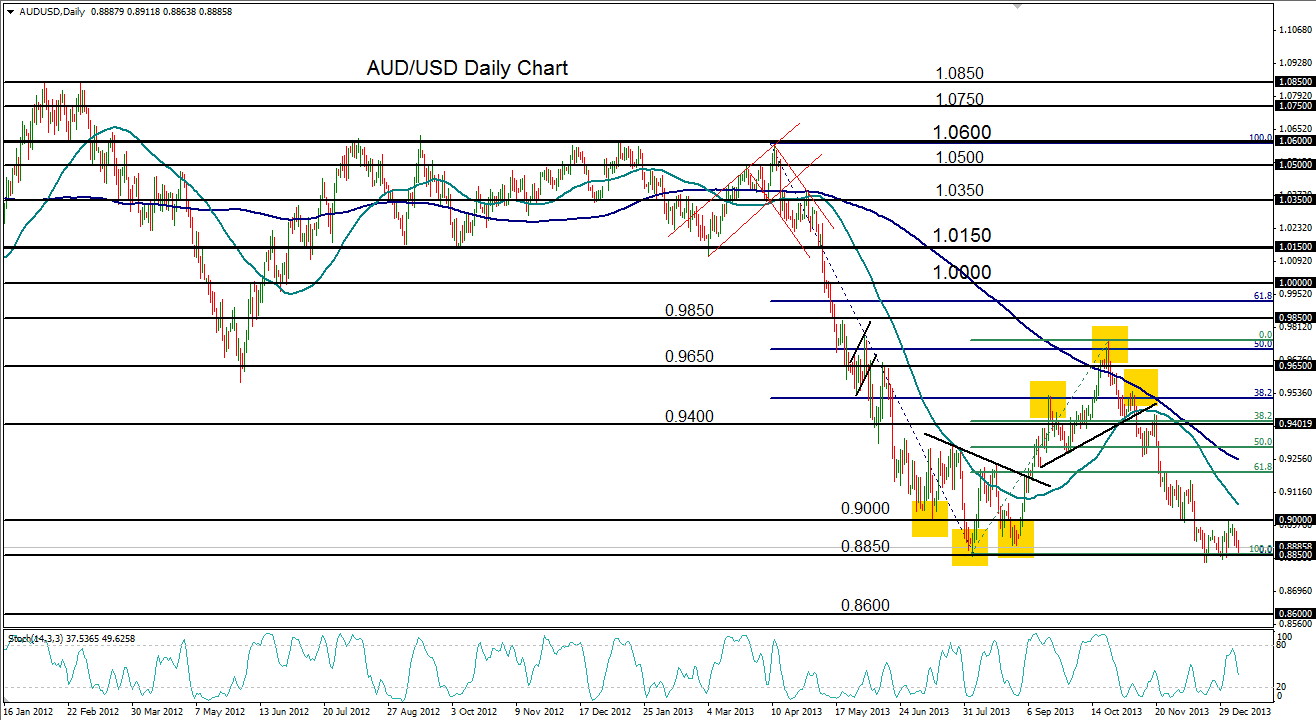
The primary theme for AUD/USD (a daily chart of which is shown) in 2013 was a drastic plummet that began in April, which followed a prolonged period of consolidation within a tight trading range.
This plummet brought price down swiftly and steeply from its April 1.0580 high and then broke down below several major support levels; including, 1.0150 and parity (1.0000) in May; 0.9400 in June; and then, ultimately, the 0.9000 level in July – before hitting close to a three-year low around 0.8850 in early August.
That 0.8850 low formed the ‘head’ of what would become an inverse head-and-shoulders pattern: a typically bullish chart reversal pattern.
After confirming the pattern by breaking out above the neckline in early September, the currency pair fulfilled its head-and-shoulders price target and subsequently moved into yet another head-and-shoulders pattern – this time an opposite bearish reversal pattern with its late October high (head) at 0.9767.
This high was also at the key 50% Fibonacci retracement level of the noted slide from the April 1.0580 high down to the August 0.8850-area low.
The breakdown below the neckline of the second head-and-shoulders pattern occurred in early November, after which there was a brief and limited pullback to the upside before a swift slide to the downside quickly fulfilled the price target for that head-and-shoulders pattern.
Price then dropped even lower, down to key support at 0.9000, before breaking down further and establishing more than a three-year low at 0.8818 in mid-December.
The beginning of 2014 saw a failed attempt to rebound significantly above key resistance at 0.9000. The current chart pattern, which closely resembles an inverted flag formation, is showing indications of potentially becoming a downside continuation pattern.
In the event that this role is fulfilled, a breakdown below the noted 0.8818 three-year low would confirm a continuation of the sharp bearish trend that has been in place since April 2013.
The next major downside price target in this case resides around the 0.8600 support level.
Moving further into 2014, a further downside target level resides around levels around 0.8300. Key upside resistance continues to reside around the important 0.9000 resistance level.
Interested in what the year might bring for the other key currency pairs? Check out the other articles in this series:
GBP/USD forecast for 2014
EUR/USD forecast for 2014
USD/JPY forecast for 2014
