AUD USD continues strong bullish stance
AUD/USD (daily chart shown below) has continued to take on a strong bullish stance as it has reached up to major resistance around the key […]
AUD/USD (daily chart shown below) has continued to take on a strong bullish stance as it has reached up to major resistance around the key […]
AUD/USD (daily chart shown below) has continued to take on a strong bullish stance as it has reached up to major resistance around the key 0.9400 level. Last week, the pair hit a 5-month high of 0.9460 before pulling back slightly.
The currency pair has generally been in a sharp advance since the late January long-term low of 0.8659. That low eventually transformed into a bottoming pattern in the form of an inverted head-and-shoulders formation.
AUD/USD broke above both the head-and-shoulders neckline and the 200-day moving average in late March, and has continued to climb sharply since then.
The recent rise in the AUD/USD provides an indication that the currency pair may have potentially hammered out a bottom and could indeed be in the midst of a rotation to the upside.
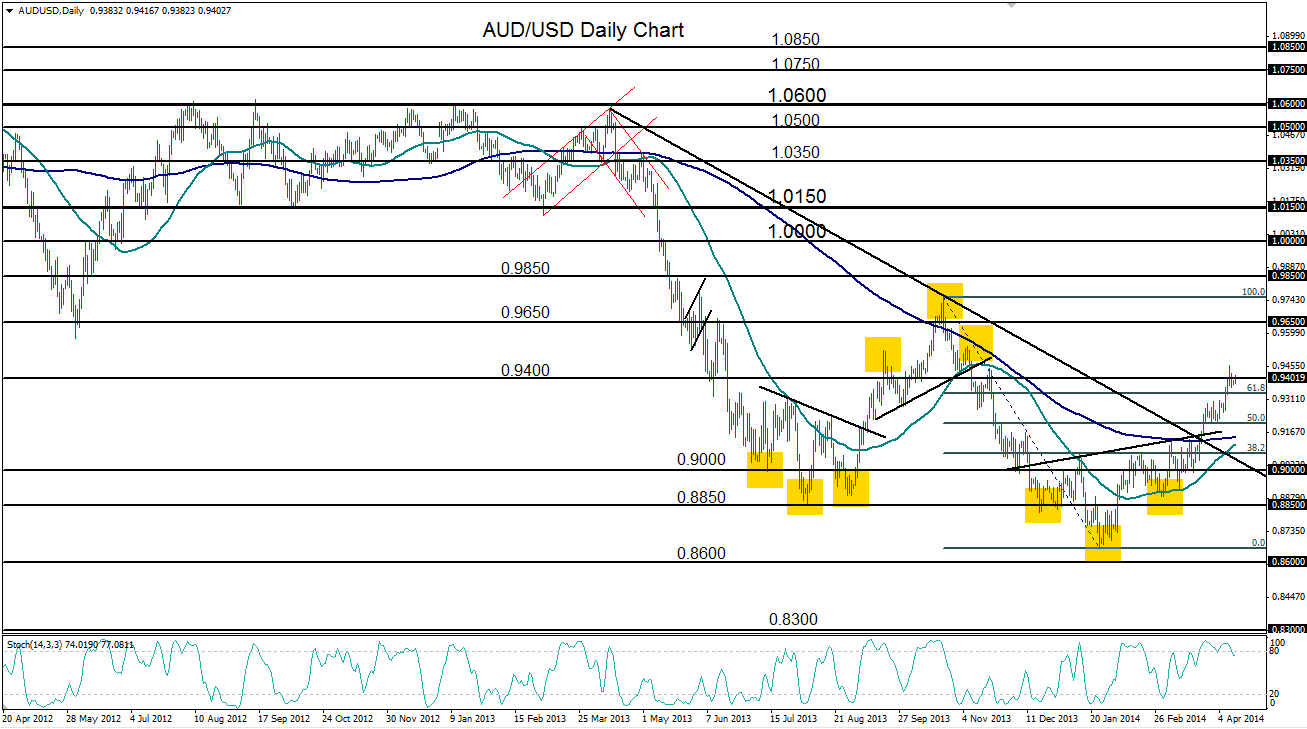
A flag pattern breakout occurred in early April, which had its first target around the 0.9400 level. Having just reached and surpassed that target level, while continuing to maintain a strong bullish stance, AUD/USD appears poised to target its head-and-shoulders price objective, around the 0.9600 level.
Short-term downside support for the pair currently resides around 0.9300, the approximate top of the broken flag pattern.
