AUD USD continues range trading within bullish trend
AUD/USD (daily chart shown below) has remained in a relatively tight consolidation within the past four weeks after hitting a 2014 high just above 0.9500 […]
AUD/USD (daily chart shown below) has remained in a relatively tight consolidation within the past four weeks after hitting a 2014 high just above 0.9500 […]
AUD/USD (daily chart shown below) has remained in a relatively tight consolidation within the past four weeks after hitting a 2014 high just above 0.9500 at the beginning of July.
This consolidation has generally fluctuated around the 50-day moving average, and well above the 200-day moving average.
Since that year-to-date high, the currency pair has maintained key trading range support around the 0.9325 level, which is also the 62% Fibonacci retracement of the most recent rise from May’s 0.9200-area lows up to the noted 0.9500-area high in July.
AUD/USD currently remains in bullish recovery mode, as the trend bias since late January’s long-term low of 0.8659 has been decidedly to the upside.
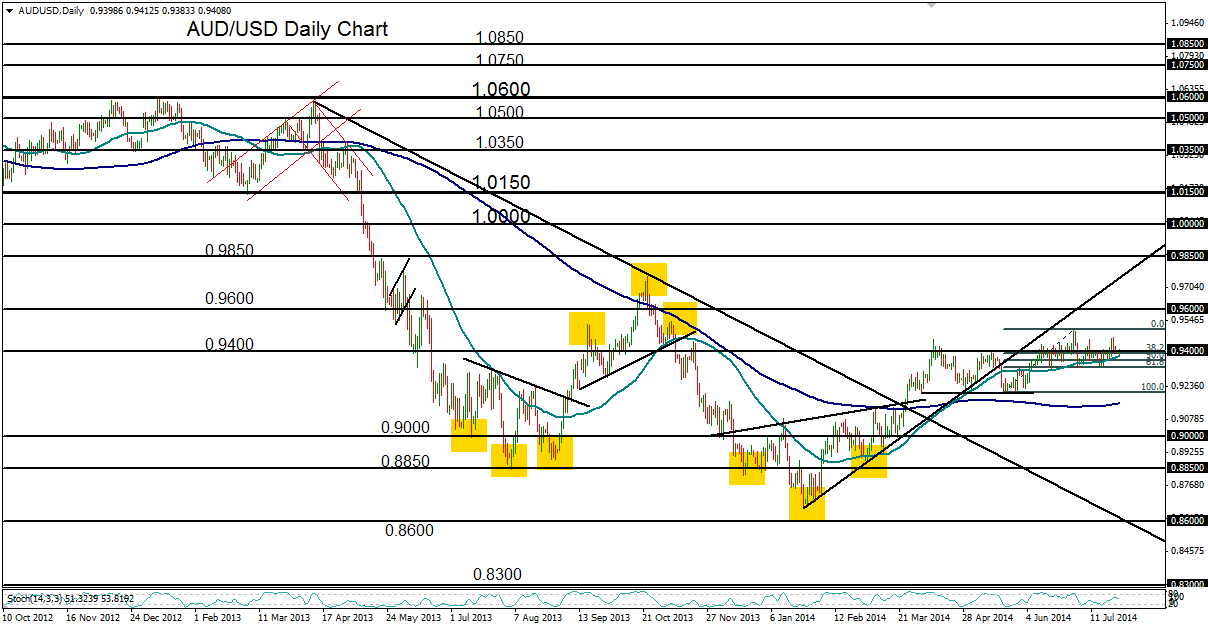
This bullish trend bias appears likely to continue further, as long as the currency pair is able to continue trading above major support around 0.9200. Any break below the noted 0.9325 current support could prompt a pullback towards this 0.9200 level.
To the upside, the bullish thesis will have been confirmed on a breakout above the 2014 high of 0.9500, in which case the major upside target resides around the 0.9600 level, which has been the targeted objective since the breakout of a large, inverted head-and-shoulders pattern in March.
