AUD USD Coiling for a potential breakout but which way
Most major markets continue to consolidate today amidst the essentially data-less global trade. Probably the day’s biggest news was the election result in Canada, where […]
Most major markets continue to consolidate today amidst the essentially data-less global trade. Probably the day’s biggest news was the election result in Canada, where […]
Most major markets continue to consolidate today amidst the essentially data-less global trade. Probably the day’s biggest news was the election result in Canada, where the Liberal Party, led by Justin Trudeau the son of former Prime Minister Pierre Trudeau, secured a surprise majority. The majority seemingly gives Trudeau a mandate to enact the expansionary fiscal policy he campaigned on, including a plan to run stimulatory deficits for the next three years. At the margin, expansionary fiscal policy could relieve some of the pressure on the Bank of Canada to try to stimulate the economy via monetary means, but traders are taking the news in stride, with USD/CAD merely edging down to 1.2975 as of writing.
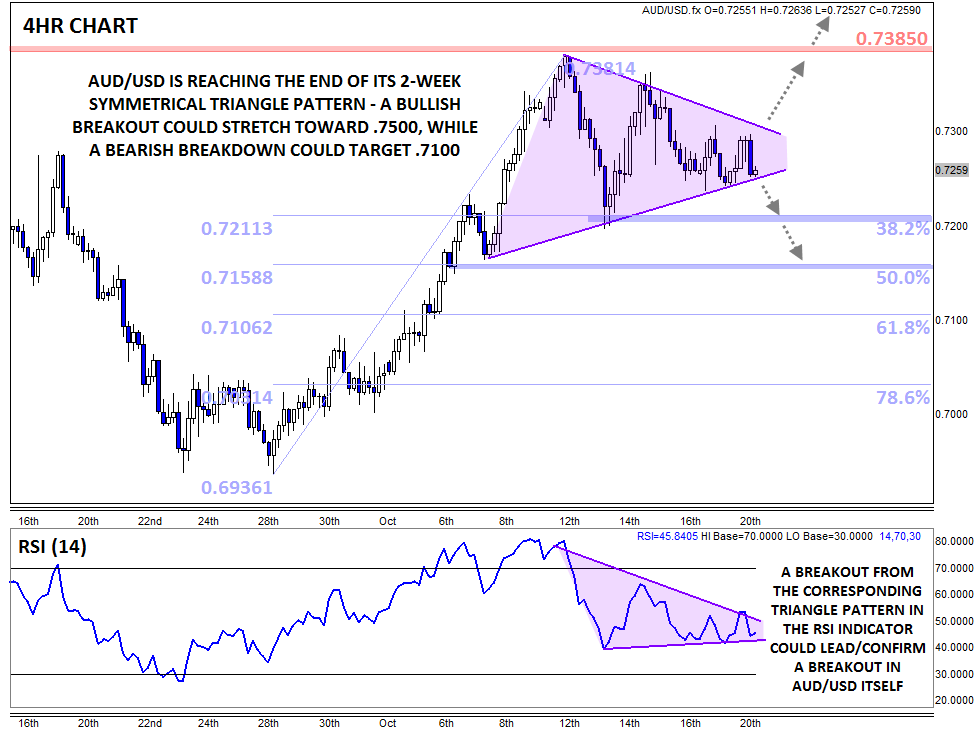
Pivoting to another commodity dollar, AUD/USD may be poised for a big breakout in the coming days. Over the last two weeks, the pair has been putting in lower highs and higher lows, creating a clear symmetrical triangle over that period. For the uninitiated, this pattern is analogous to a person compressing a coiled spring: as the range continues to contract, energy builds up within the spring. When one of the pressure points is eventually removed, the spring will explode in that direction.
While it’s notoriously difficult to predict the direction of a symmetrical triangle breakout in advance, technical oscillators can often help tilt the scales in one direction or another. In this case, the RSI indicator is forming a similar, if less precise, symmetrical triangle pattern; a breakout in the indicator could serve as a leading or confirming indicator for a breakout in the exchange rate itself.
In terms of fundamental catalysts, there isn’t much on the horizon this week. Perhaps speeches by Fed Governor Powell (Wednesday) or RBA Assistant Governor Edey (Thursday) or Thursday’s AU NAB Business Confidence survey could inject some volatility, but the chart will likely provide the clearest signal.
A confirmed bullish breakout should open the door for a retest of the long-term 38.2% Fibonacci retracement at .7385, and if that level is eclipsed, an eventual move toward .7500 is possible. On the other hand, a downside breakout would likely break previous support in the .7200 zone and expose the 50% or 61.8% Fibonacci retracements at .7160 and .7100 respectively.
 Source: City Index