AUD USD breaks down four month uptrend
AUD/USD (daily chart shown below) has broken down below a key uptrend line that extends back to January’s three-and-a-half year low of 0.8659. This trend […]
AUD/USD (daily chart shown below) has broken down below a key uptrend line that extends back to January’s three-and-a-half year low of 0.8659. This trend […]
AUD/USD (daily chart shown below) has broken down below a key uptrend line that extends back to January’s three-and-a-half year low of 0.8659.
This trend line represented a strong four-month rebound from extreme lows after forming an inverted head-and-shoulders reversal pattern earlier this year.
Having broken down below the trend line, as well as the 50-day moving average that was shadowing the trend line, AUD/USD has turned back down from key resistance around the 0.9400 level.
This 0.9400 level is around the 38.2% Fibonacci retracement level of the long slide from the 1.0600-area high in April 2013 down to January’s noted low of 0.8659.
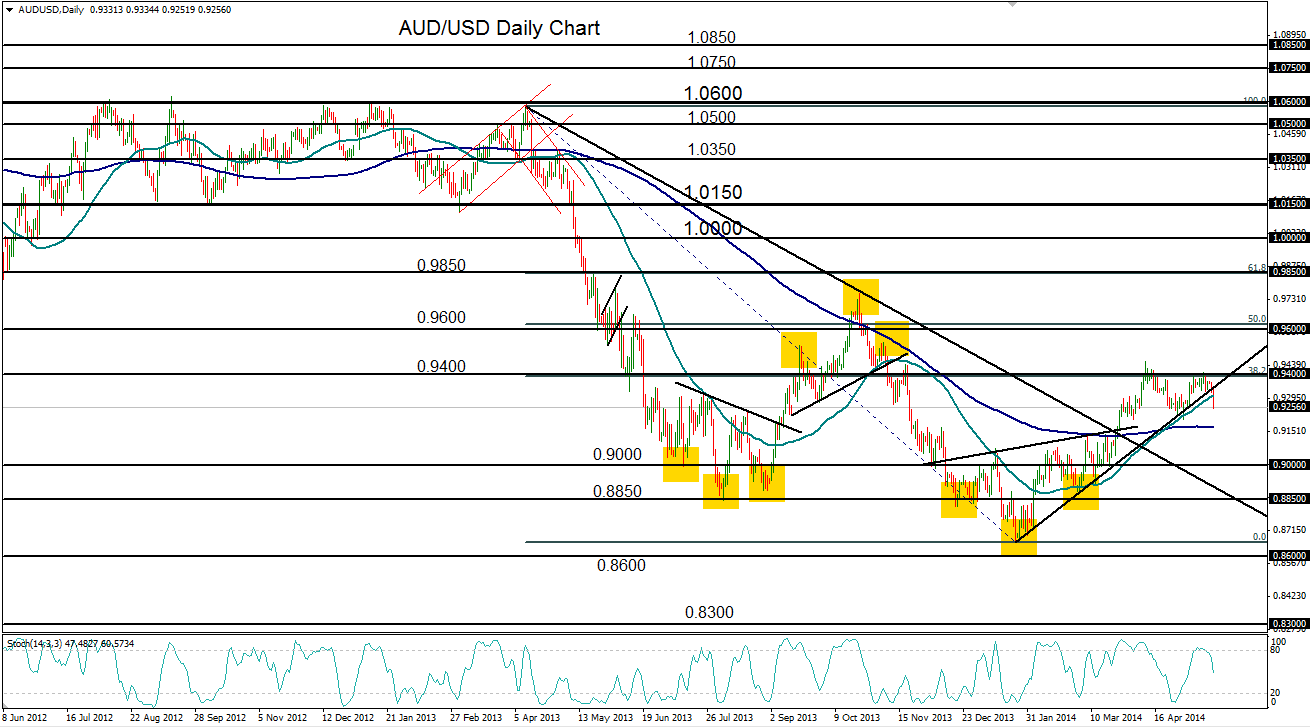
The current trend line breakdown should find key near-term support around the 0.9200 level, where price action was well-supported both in early April as well as early May.
Further to the downside lies the important 200-day moving average. If the currency pair is able to stay above this major moving average, the current rebound should remain intact, with the primary upside target continuing to reside around the 0.9600 level.
A breakdown below the 200-day average should find further downside support around the 0.9000 psychological level.
