AUD USD approaching breakdown to new multi year lows
AUD/USD (daily chart shown below) has once again dipped to approach its five-year low of around 0.8030 that was hit in early January. Since hitting […]
AUD/USD (daily chart shown below) has once again dipped to approach its five-year low of around 0.8030 that was hit in early January. Since hitting […]
AUD/USD (daily chart shown below) has once again dipped to approach its five-year low of around 0.8030 that was hit in early January.
Since hitting that low two weeks ago and then rebounding, the currency pair has consolidated in a flag-like chart pattern underneath the 0.8300 resistance level.
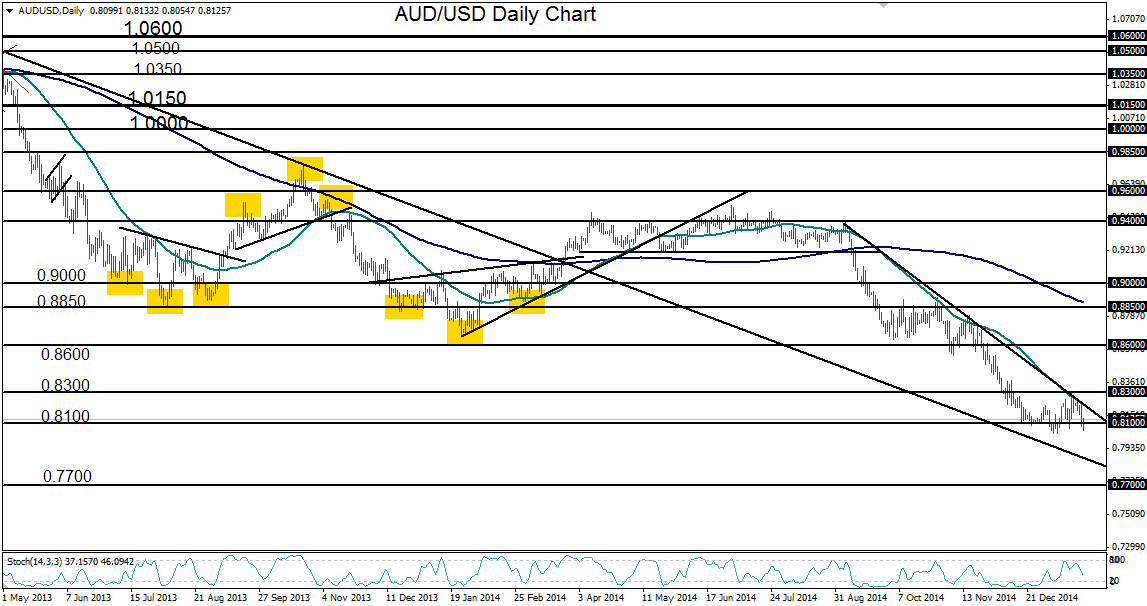
The prevailing downtrend for AUD/USD has essentially been in place since April 2013, since the 1.0600-area high. But the most recent leg of this trend began just a few months ago in early September of last year, when the currency pair broke down below a well-defined trading range.
The trend accelerated towards the end of 2014 and into the beginning of 2015, as lower multi-year lows were progressively hit. Downside support targets that were reached and breached included 0.8600, 0.8300 and most recently, 0.8100, before rebounding.
These sharp declines culminated in the currency pair hitting the noted five-year low around 0.8030 two weeks ago, which was previously hit in the latter half of 2009.
AUD/USD continues to be pressured to the downside, and could soon be poised for a breakdown to new multi-year lows.
With any continuation of the entrenched down-trend, and a subsequent break below the 0.8000 psychological support level, the next major downside target resides around the 0.7700 level.
