AUD USD Again Approaches Key Resistance
AUD/USD (daily chart) as of January 22, 2013 has once again turned to the upside in what may be yet another potential attempt at the […]
AUD/USD (daily chart) as of January 22, 2013 has once again turned to the upside in what may be yet another potential attempt at the […]
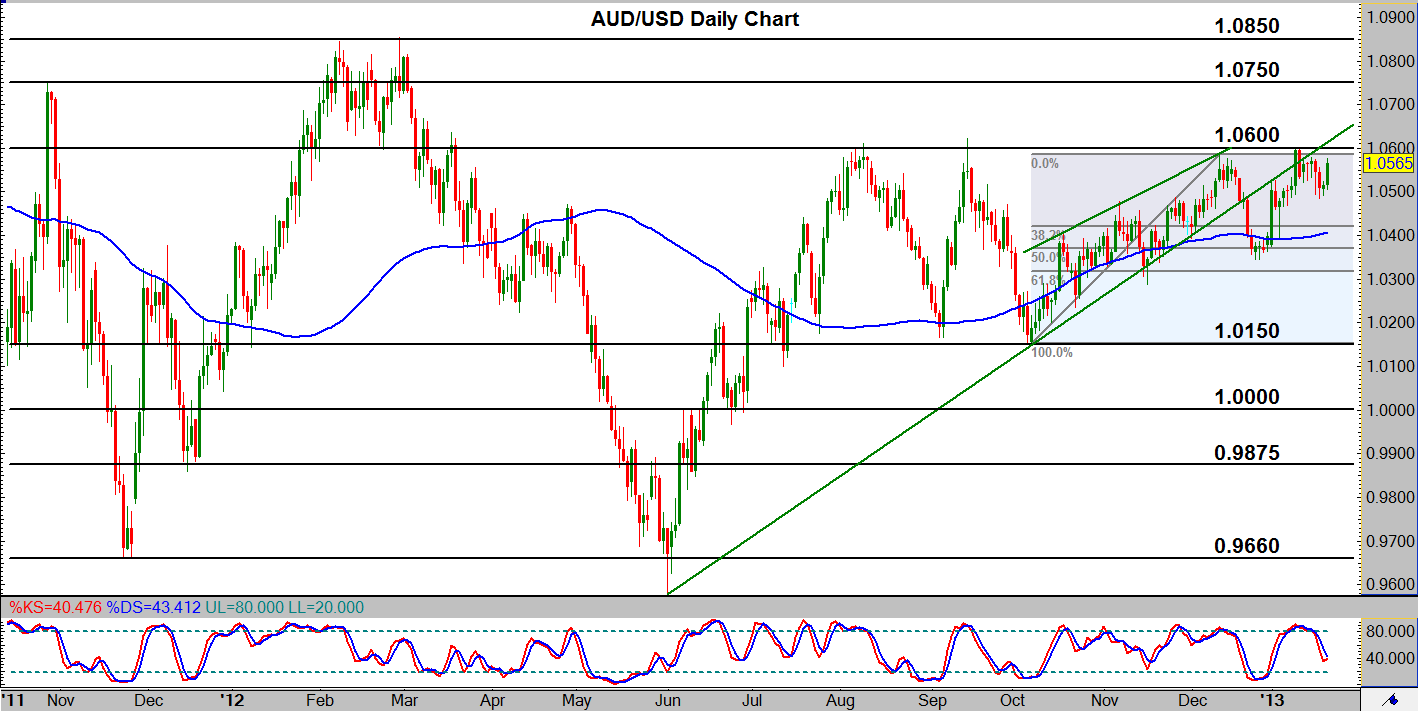
AUD/USD (daily chart) as of January 22, 2013 has once again turned to the upside in what may be yet another potential attempt at the 1.0600 price region. The 1.0600 area has served as among the strongest resistance levels for the past five months, as the pair has hit or approached the level at least four times since August 2012, and has failed to make a daily close above it each time. After each failure to breach, price has turned to the downside to form a general half-year trading range between the 1.0150 support area and the noted 1.0600 resistance area. With such strong recent historical resistance at 1.0600, this level can be considered the price to watch for any subsequent breaches or failures to breach. In the event of a significant breakout and close above the 1.0600 level, which would confirm a continuation of the entrenched bullish trend from the June 2012 0.9581 low, price could move towards further potential resistance to the upside around the key 1.0750 and then 1.0850 levels. To the downside, in the event of yet another failure at or around 1.0600, price could move back towards potential support around the 1.0350 price region, which is the area of the last major correction low in late December.