Learn how to trade indices


Asian Futures:
- Australia's ASX 200 futures are up 47 points (0.67%), the cash market is currently estimated to open at 7,029.70
- Japan's Nikkei 225 futures are up 230 points (0.84%), the cash market is currently estimated to open at 27,678.01
- Hong Kong's Hang Seng futures are up 196 points (0.71%), the cash market is currently estimated to open at 27,914.67
UK and Europe:
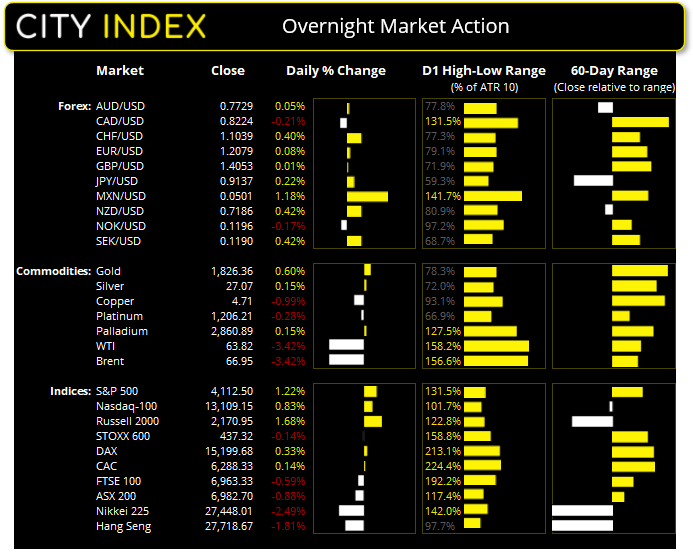
- UK's FTSE 100 index fell -41.3 points (-0.59%) to close at 6,963.33
- Europe's Euro STOXX 50 index rose 5.02 points (0.13%) to close at 3,952.45
- Germany's DAX index rose 49.46 points (0.33%) to close at 15,199.68
- France's CAC 40 index rose 8.98 points (0.14%) to close at 6,288.33
Thursday US Close:
- The Dow Jones Industrial rose 433.79 points (1.29%) to close at 34,021.45
- The S&P 500 index rose 49.46 points (1.22%) to close at 4,112.50
- The Nasdaq 100 index rose 107.513 points (0.83%) to close at 13,109.15
Learn how to trade indices
Indices post a mild rebound
Initial jobless claims fell to a 14-month low of 473k, down from 498k last week. Producer prices also rose by 6.2% YoY in April, providing further evidence of inflationary pressures. That said, prices only rose 0.6% MoM.
Wall Street broke a three-day losing streak overnight, yet all major indices produced inside days where trading acidity all took place with the prior day’s range. On that basis alone it is difficult to say whether it is part of a consolidation within the bearish move, or a mild attempt to form a base.
Energy stocks were dragged lower by weaker oil prices as cases in India continue to rise and a key pipeline in the US was reopened. The S&P 500 rebounded back above its 50-day eMA with a 1.2% rally, although found resistance at Wednesday’s high. The Nasdaq 100 notched up a 0.8% recovery yet closed the with a Rikshaw Man Doji.
The recovery (if we can call it that) was slightly more impressive on European bourses. The DAX and CAC printed bullish engulfing candles from their 50-day eMA whilst the Euro STOXX 50 produced a bullish pinbar from its 50-day eMA. The FTSE 100 closed the day with an elongated bullish pinbar after its initial selloff saw it drop to just shy of 6800.
With 73% of ASX 200 stocks below their 20-day average, market breadth suggests the index is approaching a near-term extreme which leaves the potential for a bounce. Couple this with the fact that futures are pointing higher and Wall Street produced a minor bounce overnight, it adds further weight behind it occurring today. Key support zone for bulls to monitor is 6938 – 6975 (Feb 17th high, 50-day eMA, April 12th low).
ASX 200 Market Internals:
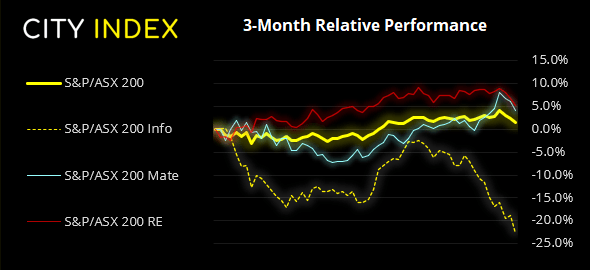
ASX 200: 6982.7 (-0.88%), 13 May 2021
- Heath Care (1.01%) was the strongest sector and Information Technology (-4.72%) was the weakest
- 8 out of the 11 sectors closed lower
- 63 (31.50%) stocks advanced, 127 (63.50%) stocks declined
- 3 hit a new 52-week high, 8 hit a new 52-week low
- 61% of stocks closed above their 200-day average
- 27% of stocks closed above their 20-day average
Outperformers:
- + 6.36% - Whitehaven Coal Ltd (WHC.AX)
- + 5.23% - Graincorp Ltd (GNC.AX)
- + 3.52% - Omni Bridgeway Ltd (OBL.AX)
Underperformers:
- -29.3% - Perenti Global Ltd (PRN.AX)
- -12.9% - Xero Ltd (XRO.AX)
- -5.39% - Afterpay Ltd (APT.AX)
Forex: Dollar is indecisive at this week’s high
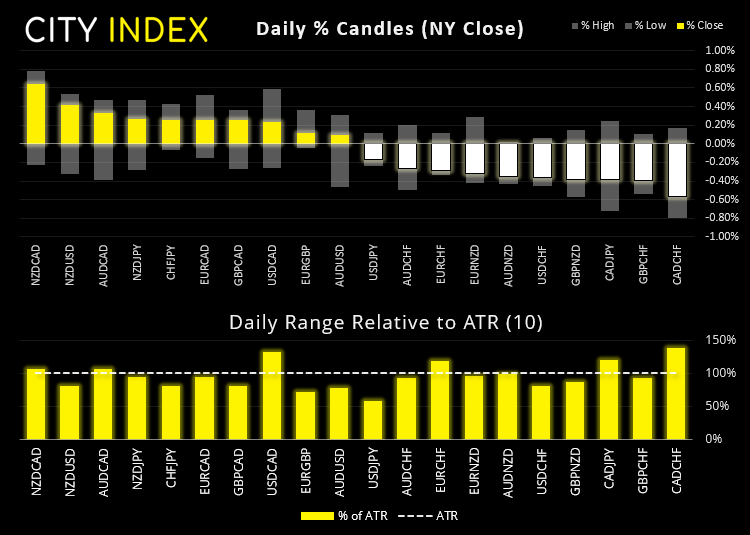
For the first time in what feels like a while, CAD was the weakest currency which was dragged lower by weaker oil prices. NZD and CHF were the strongest but, overall, it was a day of indecision candles or minor reversals.
- CAD/JPY failed to hit our 91.00 target, instead choosing to roll over ad break back below 90.00.
- CAD/CHF printed a bearish engulfing candle which raises the prospects of a double top on the weekly chart around 0.7530.
- AUD/CAD posted a small bullish candle after its decline stopped just shy of our 0.9323 target.
- The US dollar index (DXY) closed the day effectively flat, to produce a Rikshaw Man Doji (indecision candle).
- AUD/USD found support at 0.7690 and printed a small Rikshaw Man Doji
- EUR/AUD printed a bearish pinbar at the top of its 1.5690 – 1.5253 range
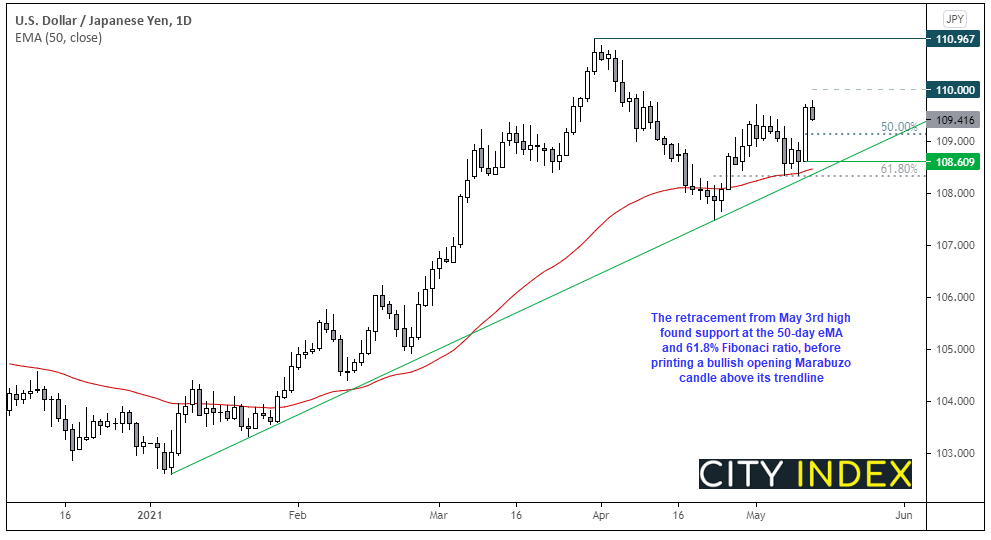
USD/JPY posted a solid recovery form its 50-day eMA and holding above trendline support projected from the January low. The retracement from the May 3rd high found support at the 61.8% Fibonacci ratio and 50-day eMA, and yesterday’s price action formed an opening Marabuzo candle (where prices open at the low and print an elongated bullish candle, with a small upper wick). We are now waiting for prices to retrace towards the 50% level of yesterday’s range (Marabuzo line) and hopefully price will stabilise before its next leg high. Our bias remains bullish above yesterday’s low, initial target is 110 with next major resistance being the April high.
Learn how to trade forex
Commodities: Energy falls on reopening of gasoline pipeline
Joe Biden confirmed that gasoline shortages should end in a few days with the reopening of the Colonial pipeline, weighing heavily on energy prices overnight. Brent and WTI futures fell around -3.4%, whilst gasoline futures dropped -3.17% and heating oil was down -3.5%.
Oil prices have continued to fall in early Asian trade with brent futures now beneath their 20-day eMA, after breaking the bullish trendline on the daily chart.
Silver printed a potential low just shy of the 26.63 support level mentioned in yesterday’s video. We’re now looking for prices to hold above support and momentum realign with its bullish trend.
Up Next (Times in AEST)
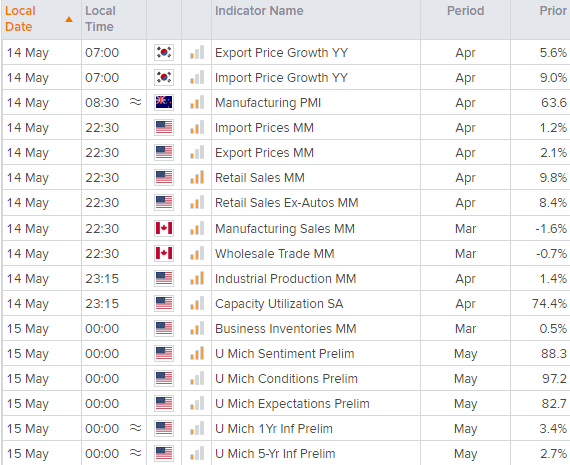
You can view all the scheduled events for today using our economic calendar, and keep up to date with the latest market news and analysis here.
Latest market news
Today 11:14 AM
Today 08:28 AM
Yesterday 03:30 PM
Latest ASX articles
April 18, 2024 02:40 AM
April 16, 2024 10:19 PM
April 10, 2024 11:24 PM
April 9, 2024 11:02 PM