


Asian Futures:
- Australia's ASX 200 futures are down -20 points (-0.44%), the cash market is currently estimated to open at 6,770.60
- Japan's Nikkei 225 futures are up 290 points (1.01%), the cash market is currently estimated to open at 29,019.88
- Hong Kong's Hang Seng futures are up 104 points (0.37%), the cash market is currently estimated to open at 28,003.61
UK and Europe:
- The UK's FTSE 100 futures are down -3 points (-0.05%)
- Euro STOXX 50 futures are up 26 points (0.69%)
- Germany's DAX futures are up 92 points (0.63%)
Thursday US Close:
- The Dow Jones Industrial rose 199.42 points (0.62%) to close at 32,619.48
- The S&P 500 index rose 20.38 points (0.53%) to close at 3,909.52
- The Nasdaq 100 index fell -18.37 points (-0.14%) to close at 12,780.51
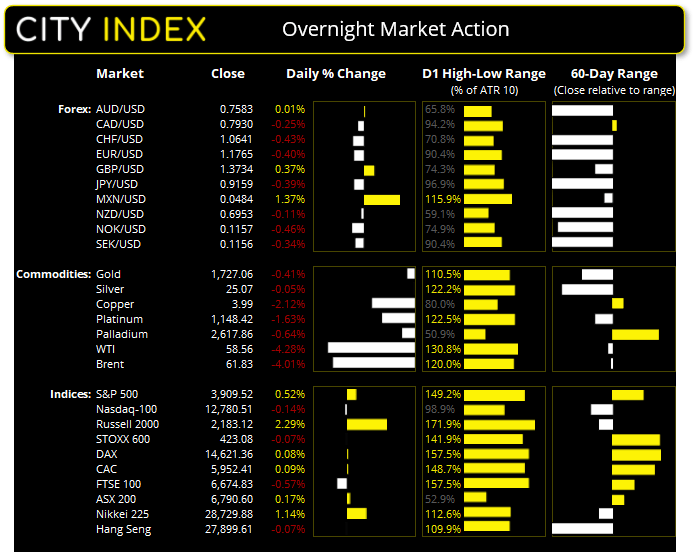
Indices: Equities
US jobless claims fell to a one-year low of 684k, its lowest level since the pandemic began. Combined with upwardly revised Q4 GDP to 4.3% from 4.1% and firmer PMI data (a predicter of future growth) then it has been a good week for US data. Still, market chatter is increasingly concerned with the potential for corporate tax hikes from the Biden administration. And that could weigh on the stock market before any anticipated tax hike comes to fruition, so we’ll keep an ear out for hints of such a move in due course.
- The S&P 500 found support at its 50-day eMA. Should prices remain above 3856 then we should consider its potential to pop higher and revert to its longer-term bullish trend.
- The Russell 2000 retraced to its 50-day eMA. As long as prices remain beneath it then we see potential for another dip lower, as outlined in yesterday’s video. Of course, if the S&P 500 pops higher then we could also find the Russell moves higher with it.
- Price action on the STOXX 50 and DAX are similar to the S&P 500 yet, as their retracements from recent highs are very shallow, they continue to look the more bullish with their bullish pinbar and hammers around the 10-day eMA on the daily chart. Ones to watch for a potential pop higher…
Learn how to trade indices
Forex: The dollar glides past its 200-day eMA
The US dollar index (DXY) closed above its 200-day eMA for the first time in 10-months. From a technical perspective we expected a bit more of a fight at this key level, but it is what it is; a firm close above it. Next resistance is now 93.20.
- EUR/USD broke beneath the 1.1800 with apparent ease overnight and fell to its lowest level since November.
- GBP/USD produced a bullish inside candle which is constructive for a minor bounce towards 1.3760 where bears could consider potential shorts, should an opportunity present itself.
- AUD/USD held above 0.7557 support and formed an indecision candle on the daily chart (Rikshaw man doji). Whilst the core view is for a lower Aussie its resilience to the US dollar overnight suggests it may carve out a sideways range or retracement before resuming its bearish move. NZD/USD finds itself in a similar position, and with no domestic news schedule for Australia or New Zealand today we may be in for quiet trade today.
- AUD/CHF held above 0.7088 support overnight. And this is not necessarily a bad thing. Prices are consolidating above support which has given the market room to breath before its next directional move. And should it be beneath support then it opens up a run towards 0.7000 as there is little I the way of obvious support level before then.
- EUR/AUD found resistance at its 50-day eMA on Wednesday and then produced a daily bearish engulfing candle overnight. With a downside bias over the near-term the next level of support is around 1.5560/73.
Learn how to trade Forex
AUD/CAD finds resistance at its 200-da eMA
The daily chart closed beneath its 200-day eMA on Wednesday then Thursday’s minor rebound (a bullish inside day) found resistance at it. With prices now consolidating in a bear flag formation near recent lows and within a clear downtrend. Given the 200-day eMA is capping as resistance it makes the directional bias and invalidation point relatively easy.
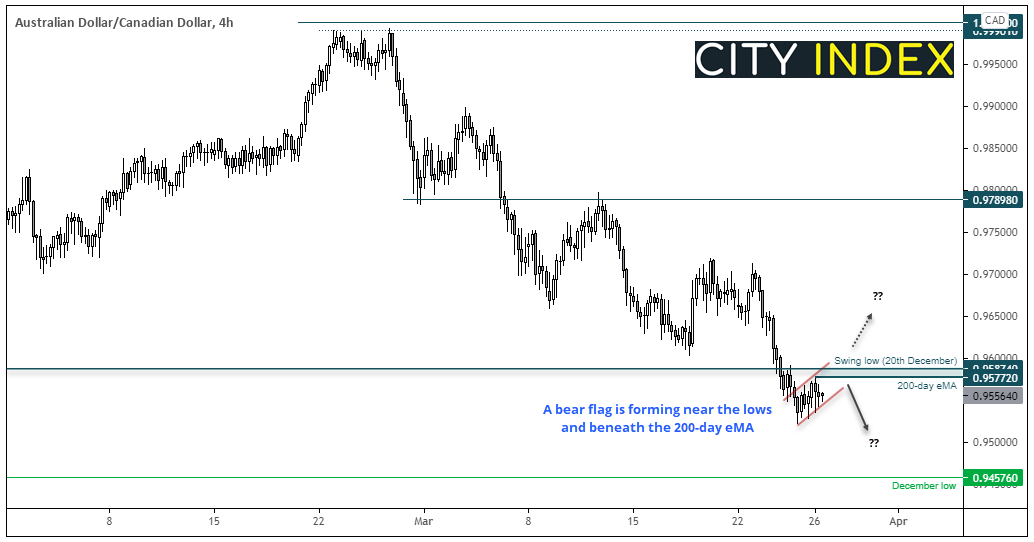
- A break below the flag (or recent lows for a more conservative approach) assumes bearish continuation.
- Next bearish target is just above the December low.
- A clear break above 0.9600 invalidates the bearish bias.
- Allow for some ‘noise’ around resistance. For example, spikes above 0.9600 which leave bearish reversal candles would still keep our interest for a potential bearish breakdown.
Commodities: The volatile chop for oil prices continue
It was another volatile session, and one which countered its previous days direction with WTI and brent falling over -4%. Such conditions can make entering on the daily timeframe tricky at best with such fickle direction. Therefore, our view remains the same as yesterday; if traded at all, perhaps best for intraday timeframes, although such traders would be wise to stay nimble and not get too attached to their directional bias for the day.
A bearish outside day formed on gold (XAUUSD), and around half of its daily range was the upper wick. Yet whilst it shows bears dominated the session overall it, their inability to drive prices down to 1718.40 support could also be seen as a sign of weakness. And this is why we switched our view from near-term bearish to step-aside; its price action is choppy and making hard work of moving lower, chances are it may be susceptible to a sharp move higher, in line with our core bullish gold view (formed when 1700 was successfully defended with a strong bullish pinbar).
Copper is back blow $4 and broke to the downside od its 2-week range. Whilst our core view is for it to retain its bullish trend, momentum now points lower and could send prices back to the bullish trendline projected from its October low.
Up Next (Times in AEDT)
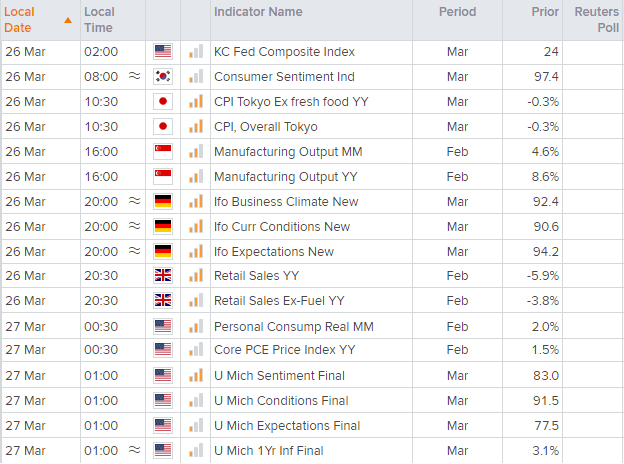
You can view all the scheduled events for today using our economic calendar, and keep up to date with the latest market news and analysis here.
Latest market news
Today 08:28 AM
Yesterday 03:30 PM
Yesterday 01:23 PM
Yesterday 11:00 AM
Yesterday 08:15 AM
Latest Equities articles
April 12, 2024 02:28 AM
April 7, 2024 08:46 PM
March 31, 2024 11:22 AM
