


A slew of US data overnight saw inflationary inputs, unemployment and housing permits rise in tandem. Welcome to 2021! Jobless claims rose by 861k, which is 96k more than the 765k expected and 793k prior. Moreover, last week’s number was upwardly revised to 848k, which means most data this year has been above levels seen during the GFC (global financial crisis). In contrast, building permits surged by 1.88m which is its highest level since May 2006 to show increased demand (and upwards pressure on construction). Oh, and import prices also increased at their fastest rate in nine years, rising by 1.4% in January versus 1% expected.
US indices: Bullish hammer or hanging men?
US indices traded lower initially yet recovered losses by the close of the session, leaving a series of bullish hammers along the way. That said, such candles need confirmation. So, if we are to see prices break beneath the candle lows they will then be labelled as ‘hanging men’ or bearish hammers. The Dow Jones closed -0.38% lower and our attention I on 31,270 (previously a record high) as it could prove to be pivotal for bulls and bears. The S&P 500 closed -0.44% lower and its equivalent pivotal level to monitor is 3870.
The FTSE 100 is currently on track for a bearish hammer, having found strong resistance at its 200-week eMA. A glance at the monthly charts also shows a bearish hammer last month which found resistance at its 50-month eMA, so perhaps all is not so well in the land of FTSE.
The ASX 200 remains above its 10-day eMA and is on track for a bullish engulfing week. That said, it is making hard work of breaking convincingly higher so it remains an index to trade over shorter time horizons in our view, and not a market to outstay someone’s welcome.
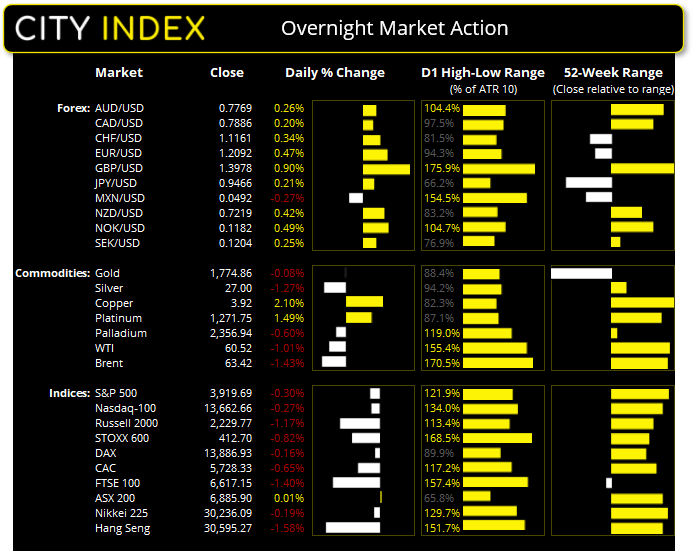
Gold bugs remains quiet, oil slips at the highs
Gold continues to tease bears with a break of 1764.73 support, yet their hesitancy is underwhelming. This only increases the odds of a minor rebound from current levels, even if it is a ‘last hurrah’ before it eventually breaks to the downside anyway. Regardless, 1764.73 remains a key level (and likely pivotal) for bulls and bears to plan their trades around.
Copper remains a force to be reckoned with, which now sits at its highest level since April 2012 as the reflation trade continues to drive metals (excluding gold and silver) higher. Platinum remains above its 10-day eMA and just off its 6-year highs although it is currently on track for an elongated doji (spinning top) on the weekly charts.
WTI is back below $60 after printing a bearish engulfing candle below a long-term bearish trendline. The trendline is projected from the all-time high of 147.27 and appears to be the first technical level of significance to take the wind out of its bullish sales. To some, it is debatable as to whether to fade such a bullish move but, given the rally from November’s low is yet to produce a sizeable pullback, it hesitancy to break above the trendline does warrant some attention.
Australian employment continues to dazzle
Australian unemployment fell to 6.4% compared with 6.5% forecast and 6.6% prior. It continues to perform better than RBA’s best-case scenario outlined in their MPR (monetary policy support) but we shall have to see how it fares when the JobKeeper scheme finishes in March. 29.1k jobs were added in January, 59k of which were full-time which suggests 29.9k part-time jobs were shed or exchanged for full-time work. All in all, a good report for RBA to glean over.
A softer dollar sees GBP/USD eyeing 1.4000
As for currencies, the US dollar index (DXY) is back below the 50-day eMA and the dollar was mostly lower against its peers, excluding the Mexican peso. GBP/USD was the strongest performer and printed a bullish engulfing candle at the highs and appears set to challenge the 1.4000 handle. Like it or not, the daily trend remains defiantly bullish whilst it holds above the 1.3570 low, and the near-term bias remains bullish above 1.3830. EUR/USD stopped shy of falling to 1.2000 and instead printed a bullish inside day. Yet with the weekly chart on track for a Doji to show indecision, we do not see this as a pair to trade on higher timeframes; instead, we’d prefer to remain nimble and enter on intraday timeframes, if at all.
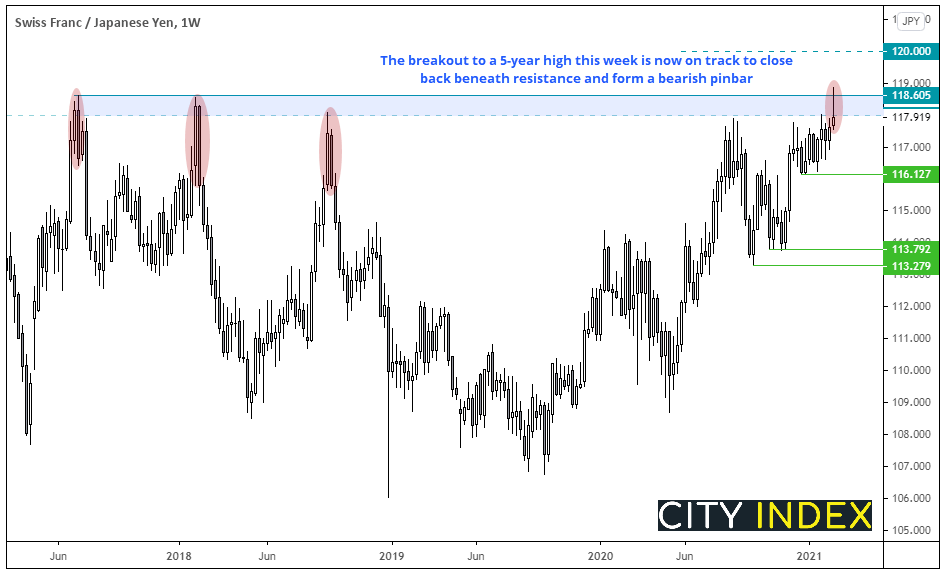
CHF/JPY: Have we seen the top?
As we outlined earlier this week, CHF/JPY has a tendency to roll over when it tries to break above 118. To its credit, it managed to break to a 5-year high this week, but it is now on track for a bearish weekly pinbar and close beneath…. 118! Given bearish declines have fallen anywhere between -4% and -10% from current levels since 2017, a contrarian short view may well provide a decent reward to risk ratio around current levels.
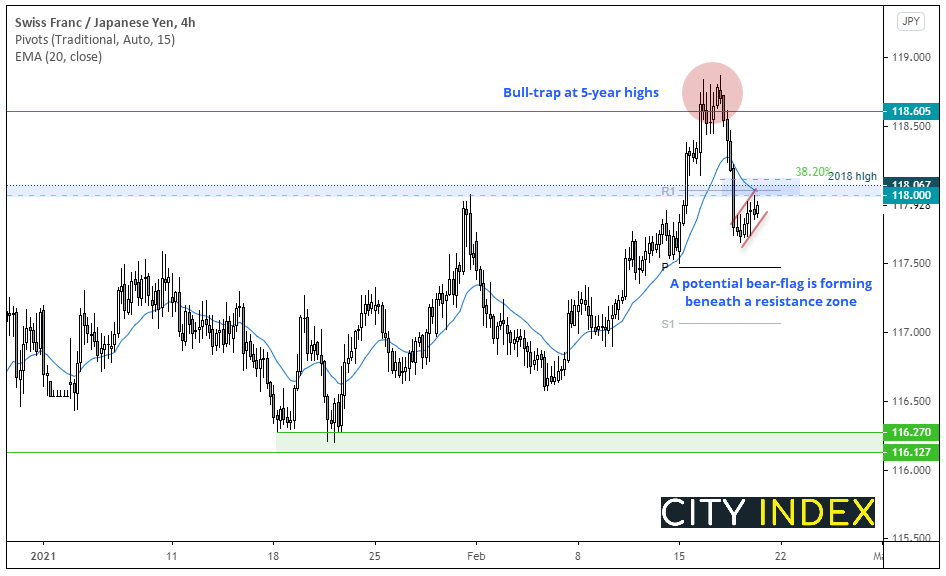
Switching to a more tradable timeframe (the four-hour chart) shows the sharp reversal from its highs and a potential bear-flag pattern. Ultimately, we would like to see the 2018 high and monthly R1 pivot hold as resistance before turning lower. That the 38.2% Fibonacci ratio and 20-bar eMA reside around these levels also adds credence to the potential resistance zone.
- Bears can consider shorts with a breakout of the bearish flag. A more conservative approach is to wait for a break of its recent swing low
- The initial target is the swing low and monthly pivot around 117.50
- A break above the resistance zone invalidates the near-term bearish bias.
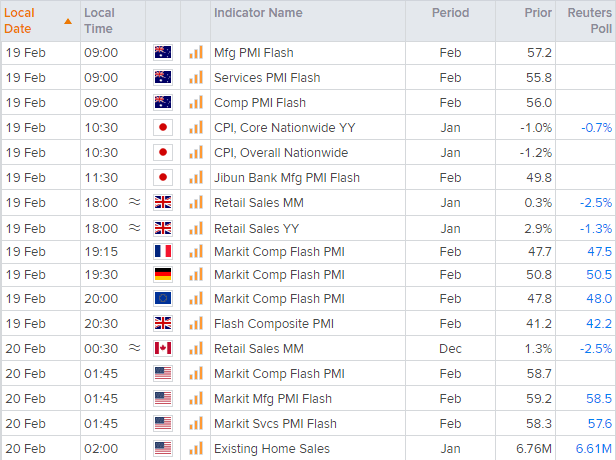
Up Next (Time in AEDT)
- Producer prices for NZ are up at 8:45. Output prices have contrate by -0.3% for the past two quarters, although input prices rose to 0.6% in Q3.
- PMI data (manufacturing, services and composite) for Australia is also released shortly after at 09:00. This could make AUD/NZD an interesting play if a divergent theme materialises (for example, strong AU PMI and weak NZ PPI could e of interest to AUD/NZD bulls).
- As for the European and US sessions, flash PMI data are the main economic events. EUR/USD is one to watch around these events.
Latest market news
Latest Indices articles

April 17, 2024 11:00 AM
April 16, 2024 08:00 PM
April 16, 2024 04:54 PM