


Asian futures:
- Australia’s ASX 200 futures are currently up 16 points (0.24%), the cash market is currently estimated to open at 6,778.3
- Nikkei 225 futures are currently up 60 points (0.20%), the cash market is currently estimated to open at 29,468.17
- Heng Seng futures are currently up 151 points (0.52%), the cash market is currently estimated to open at 29,246.86
FTSE 100:
- FTSE 100 futures are currently up 45.5 points (0.69%)
European futures:
- Euro STOXX 50 futures are currently up 2 points (0.05%)
- Germany’s DAX future are currently up 41 points (0.29%)
- France’s CAC 40 futures are currently up 21.5 points (0.37%)
Tuesday’s US close:
- The Dow Jones index fell -143.99 points (-0.46%) to close at 31,391.52
- The S&P 500 index fell -31.53 points (-0.81%) to close at 3,870.29
- The Nasdaq 100 index rose 81.84 points (0.63%) to close at 13,059.949
US indices failed to retain their bullish momentum seen on Monday, with all four majors we track stalling at Monday’s highs and trading within tight ranges. The Nasdaq 100 found support at its 50-day eMA yet closed -0.76% lower. A break beneath 13,051.70 confirms a bearish 2-bar reversal (dark cloud cover) whilst a break above yesterday’s high invalidates the pattern’s potential. The Dow Jones produced a small Rikshaw Man doji to show price compression, and a tight range for traders to consider a breakout (in either direction).
Trade on the ASX 200 has been choppy of late, with the past seven days alternating between bullish and bearish closes with varied levels of volatility. But ultimately, no directional conviction. Whilst SPI 200 futures currently suggest a higher open for the cash market, the cash index remains one to trade on intraday timeframes and not outstay ones welcome until we see a clear breakout above 6,940 or below 6658 on the daily charts.
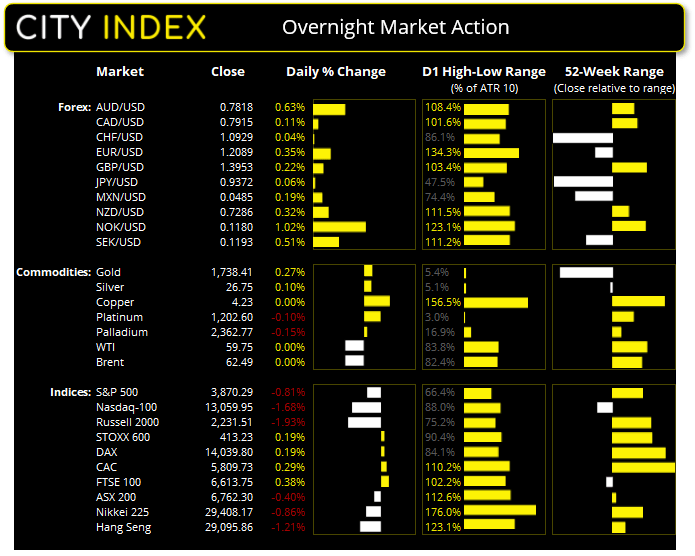
Forex: US dollar falters at 3-week high
The US dollar index (DXY) found resistance at the 100-day eMA and tried its best to finish the session with a bearish outside candle, closing just above Tuesday’s low around its 50-day eMA. The selling began around mid-way through the European session and continued through the US.
USD/CAD fell two a 2-day low and invalidated yesterday’s bullish bias with a break beneath 1.2634 support, and now trades just above the January 2021 low. Canada’s annualised GDP increased by 9.6% versus 7.5% expected and saw Q3’s hefty 40.5% growth upwardly revised to 40.6%.
EUR/USD survived an attempted spike below 1.2000 and printed a bullish engulfing hammer. And this is despite German retail sales falling -4.5% in February, missing the -0.3% forecast and seeing the YoY rate fall -8.7% versus 1.3% expected. It rebound appears to be more of a technical play and dollar weakness though, as 1.2000 was always going to be a closely watched level (as it was in February when bears failed to keep prices beneath it).
AUD/USD closed back above the January 2021 high after its second consecutive bullish session rallying from its 50-day eMA. Intraday rallies have been supported by rising volume, yet price action remains within Friday’s elongated bearish range. Copper and US equities may hold the key to how AUD performs from here; copper has produced a bullish outside candle on the daily chart, so if equities can break higher from here it could provide another tailwind for the Aussie. Still, until it breaks above 80c then downside risks prevail.
Commodities: Copper flexes its muscle
The weaker dollar was supportive of metals with gold printing a small bullish hammer around our bearish 1,700 target overnight. Silver is holding above its 50-day eMA but, in all honesty, there are far easier markets to trade right now as it lacks directional conviction. Copper flexed it muscle and rallied from its 10-day eMA with a large bullish engulfing candle to suggest the swing low is in place.
Oil prices remain under pressure ahead of tomorrow’s OPEC+ meeting. WTI futures now trade at the 20-day eMA around 59.23 and Brent has fallen to 62.53, notching up their fourth consecutive session.
AUD/CAD: Bulls regain control above the 50-day eMA
Price action on AUD/CAD’s daily chart suggests a swing low has formed and another attempt to break above parity could be on the cards.
Prices have again found support at the 50-day eMA. An inverted hammer suggested a change of momentum has occurred after last week’s sell-off and yesterday’s bullish candle confirmed a 3-bar bullish reversal (morning star reversal pattern). Similar patterns were seen in January and February, although they were technically 4-bar reversals. Still…
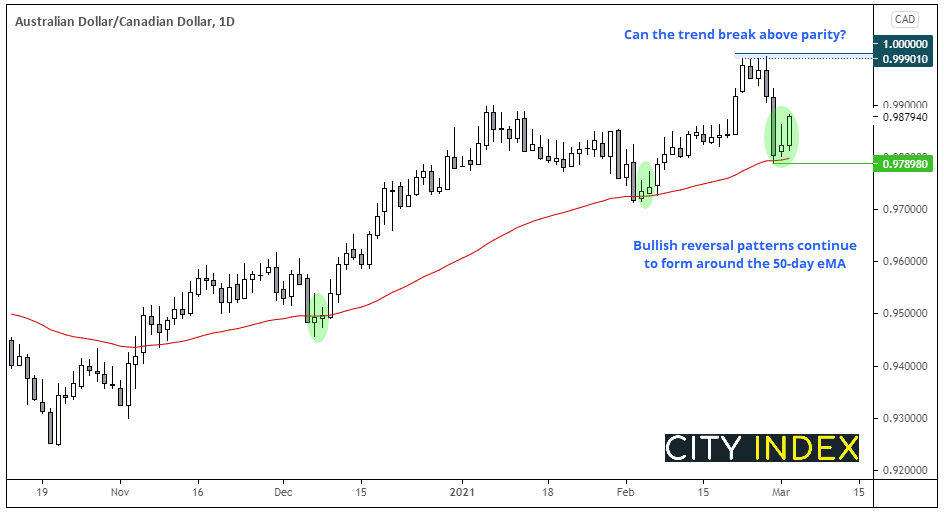
However, should prices break below 0.9789 support it confirms a bearish outside week and assumes further downside.
- The bias remains bullish above 0.9789 on the daily chart
- Bulls could look to enter dips within yesterday’s range or enter on a break above yesterday’s high
- The initial target is the highs just below parity. If prices broke above parity we’d want evidence that it had switched to support before considering new longs.
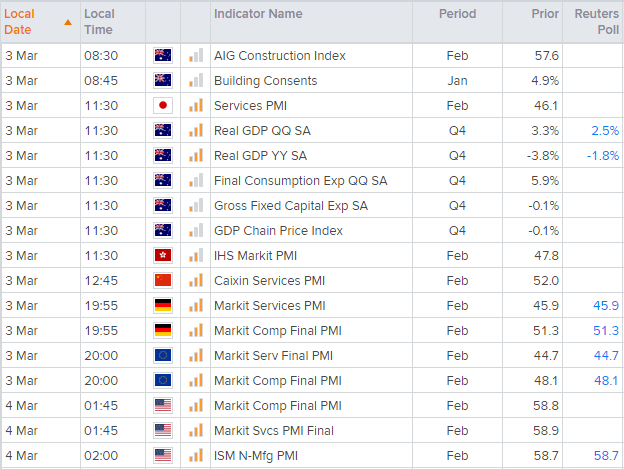
Up Next (Times in AEDT)
You can view all the scheduled events for today using our economic calendar, and keep up to date with the latest market news and analysis here.
Australian GDP is the main economic event in today’s Asian session. GDP is forecast to rise 2.5% in Q4, although arguably the focus is now on leading indicators for Q1 to see if it is on track to average 3.5% this year, in line with RBA’s expectations. Still, a downside surprise may be enough to knock quite a few pips of AUD pairs.
China’s service PMI is also released but it runs the risk of undershooting expectations, given the report covers the Chinese New Year. It also means that January’s figures may have been firmer ahead of the holiday’s, so one approach is to simply take an average of January and February’s numbers for a proxy read of the service PMI in February.
Latest market news
Latest Equities articles
April 12, 2024 02:28 AM
April 7, 2024 08:46 PM
March 31, 2024 11:22 AM
