


Asian Futures:
- Australia’s ASX 200 futures rose 7 points (0.1%), the cash market is currently estimated to open at 7302.4
- Japan's Nikkei 225 futures have risen 210 points (0.73%), the cash market is currently estimated to open at 29151.52
- Hong Kong's Hang Seng futures are up 176 points (0.61%), the cash market is currently estimated to open at 29094.1
European Friday close:
- UK's FTSE 100 index rose 4.69 points (0.07%) to close at 7069.04
- Europe's Euro STOXX 50 index rose 10.14 points (0.25%) to close at 4089.38
- Germany's DAX index rose 60.23 points (0.39%) to close at 15692.9
- France's CAC 40 index rose 7.74 points (0.12%) to close at 6515.66
US Friday close:
- The Dow Jones rose 179.39 points (0.52%) to close at 34,756.39
- The S&P 500 rose 37.04 points (0.89%) to close at 4,229.89
- The Nasdaq 100 rose 241.091 points (1.78%) to close at 13,770.78
Learn how to trade indices
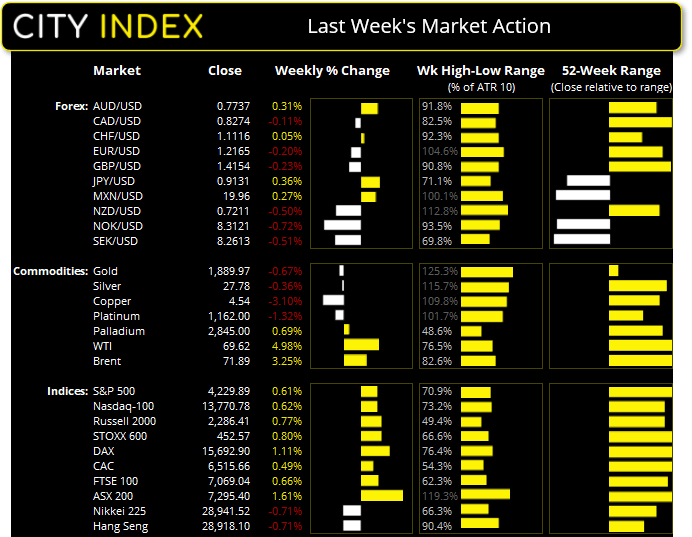
The S&P500 closed just shy of its record high last week, printing a small bullish hammer above its 10-week eMA. Closing less than 10 points beneath its record high suggests it could set new highs sooner than later, even if a small bearish pinbar appeared at the last hour of trade. Key support levels for bulls to defend are 4220 and 4212 (gap support). Should a new level of support build at or around these levels it could mark the prelude to a bullish breakout.
The ASX 200 closed at a fresh record high with a three-day bullish streak by Friday’s close. OBV (on balance volume) continues to confirm the rally as it tracks prices higher, although a small warning for the near-term comes from RSI (2) which now sits at 95.48. Such a short RSI setting does little for picking out long-term reversals but can provide decent warnings for near-term over-extension. RSI (14) currently sits at 68, which simply points towards a healthy uptrend. Key support levels for bulls to defend today are 7281 – 7287 and 7250.0.
ASX 200 Market Internals:

ASX 200: 7295.4 (0.49%), 06 June 2021
- Utilities (1.39%) was the strongest sector and Materials (-1.48%) was the weakest
- 7 out of the 11 sectors outperformed the index
- 9 out of the 11 sectors closed higher
- 117 (58.50%) stocks advanced, 69 (34.50%) stocks declined
- 72% of stocks closed above their 200-day average
- 66.5% of stocks closed above their 50-day average
- 77.5% of stocks closed above their 20-day average
Outperformers:
- + 6.26% - ARB Corp Ltd (ARB.AX)
- + 5.36% - Origin Energy Ltd (ORG.AX)
- + 5.12% - Bendigo and Adelaide Bank Ltd (BEN.AX)
Underperformers:
- -8.22% - Silver Lake Resources Ltd (SLR.AX)
- -7.69% - Ramelius Resources Ltd (RMS.AX)
- -6.28% - Appen Ltd (APX.AX)
Forex: The dollar’s bounce fails after disappointing NFP report
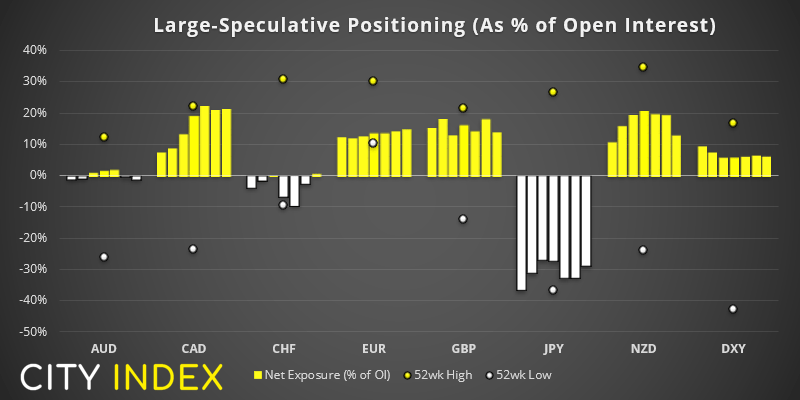
From the weekly COTR (Commitment of Trader Report) at 1st June 2021:
- Traders were net-long Canadian dollar futures at their most bullish level since October 2017.
- Bullish exposure to euro futures was at its highest level in 14 weeks.
- Net-long exposure to copper futures fell to their least bullish level in 12-months.
- Exposure to Swiss franc futures flipped to net-long for the first week in seven weeks.
- Overall, the weekly change across FX majors was low (all under 10k contracts)
The US dollar index (DXY) quickly reversed most of Thursday’s gains as the monthly Nonfarm Payrolls report ‘only’ printed around 550k jobs, below the 650k expected. These numbers are still not bad, even if traders were positioned for something more spectacular. As for price action, it was another week, another Doji. Yet again we see an indecisive candle hovering above the January lows, and close the week marginally above 90.0. The longer this pattern repeats the greater the odds of a bounce. Like it or not, traders remain bullish on DXY and bears are failing to push it lower. Although they need to break prices above 90.70 to see it above its 50-day eMA.
That said, EUR/USD has remained above its 50-day eMA and printed a two-bar bullish reversal (bullish piercing line) as of Friday. But given a break above Thursday’s high is required to confirm it, and this is at a cluster of resistance levels, it’s a hard reversal pattern to trade with any confidence. If the dollar is to stand any chance of halting its decline then we need to see further weakness on the euro beneath 1.2266.
The Australian dollar was the strongest major last week, among FX majors. A better-than-expected GDP report was the culprit, and this saw a rotation out of the New Zealand dollar which was the weakest currency last week.
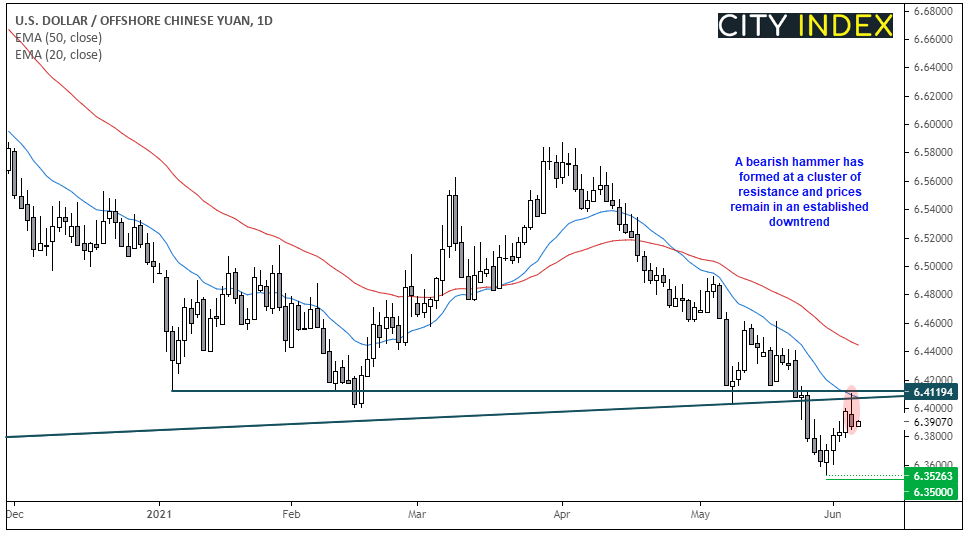
USD/CNH has retraced from its multi-year lows yet stalled at a cluster of resistance. Trendline resistance from the Feb 2014 low, alongside the January 2021 low and 20-day eMA capped gains on Friday and a bearish hammer has formed. Given it remains in an established downtrend and a retracement has occurred (to remove any fears of oversold conditions) our near-term bias remains bearish below Friday’s high and for a re-test (and potential break below) 6.3500.
Learn how to trade forex
Commodities:
Gold recouped around two-thirds of Thursday’s sell-off, and prices remain above trendline support from the March low. With support now in place around 1855 we are seeking a break above Friday’s high to suggest bullish trend continuation.
Silver’s bullish channel was literally obliterated on Thursday, thanks to its most bearish session in nearly three months. It tried (yet failed) to close beneath 27.20 support, but the fact it penetrated this key support level suggests the tide may have turned. Whilst prices remain below the 28.32 high (and now defunct bullish channel) we continue to suspect an interim top has been seen. A breal below 27.00 assumes bearish continuation.
Platinum finally rolled over on Thursday. We have been waiting for such an event since prices broken beneath trendline support two weeks ago. Whilst a small bullish pinbar occurred on Friday, we suspect the swing high is in place at 1217.60 and remains bearish beneath this level.
Up Next (Times in AEST)
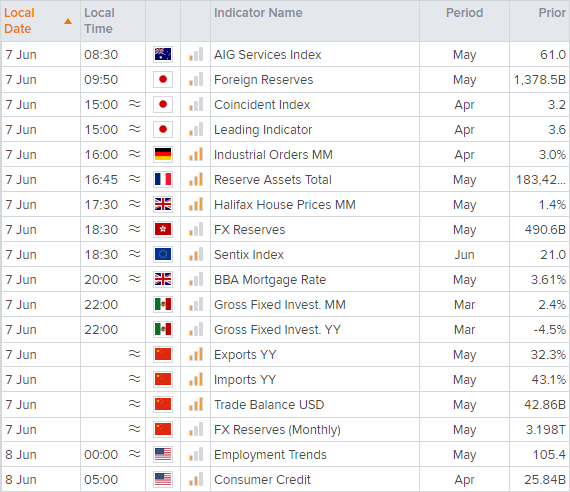
You can view all the scheduled events for today using our economic calendar, and keep up to date with the latest market news and analysis here.
Latest market news
Yesterday 10:40 PM
Yesterday 04:00 PM
Latest Indices articles
April 18, 2024 04:46 PM
April 17, 2024 11:00 AM
April 16, 2024 08:00 PM
April 16, 2024 04:54 PM