


Asian Futures:
- Australia's ASX 200 futures are up 35 points (0.47%), the cash market is currently estimated to open at 7,452.00
- Japan's Nikkei 225 futures are up 90 points (0.3%), the cash market is currently estimated to open at 30,601.71
- Hong Kong's Hang Seng futures are down 1 points (0%), the cash market is currently estimated to open at 25,034.21
UK and Europe:
- UK's FTSE 100 index fell -17.57 points (-0.25%) to close at 7,016.49
- Europe's Euro STOXX 50 index fell -45.73 points (-1.09%) to close at 4,145.94
- Germany's DAX index fell -106.99 points (-0.68%) to close at 15,616.00
- France's CAC 40 index fell -69.35 points (-1.04%) to close at 6,583.62
Wednesday US Close:
- The Dow Jones Industrial rose 236.82 points (0.68%) to close at 34,814.39
- The S&P 500 index rose 37.65 points (0.85%) to close at 4,480.70
- The Nasdaq 100 index rose 120.63 points (0.78%) to close at 15,503.53
Learn how to trade indices
Indices:
Higher energy prices saw equity markets wipe off Tuesday’s losses and rally throughout most of the session. The S&P 500 rose 0.82% with 10 of its 11 sectors rising, led by energy and materials sectors. The index held above its 50-day eMA and trendline support, erasing the prior day’s gains of its bearish engulfing day. A break above Monday’s high assumes a swing low has been seen. Tech stocks were also strong performers with the Nasdaq 100 rising around 0.8%.
The ASX 200 remains undecided as to which way its next directional break will be. However, we’d expect energy-related stocks to support the broader market today, yet iron ore prices continue to fall which is a headwind for the index. Still, we’ve seen two lower tails these past days to show demand at the lows, so we’re also keeping an eye on a countertrend bounce and for prices to break above 7450. Support sits around 4015, 4000 and 7378.
ASX 200 Market Internals:
ASX 200: 7417 (-0.27%), 15 September 2021
- Information Technology (1.04%) was the strongest sector and Utilities (-1.8%) was the weakest
- 8 out of the 11 sectors closed lower
- 83 (41.50%) stocks advanced, 105 (52.50%) stocks declined
- 67.5% of stocks closed above their 200-day average
- 56% of stocks closed above their 50-day average
- 46.5% of stocks closed above their 20-day average
Outperformers:
- + 8.41% - Pilbara Minerals Ltd (PLS.AX)
- + 4.69% - Elders Ltd (ELD.AX)
- + 3.67% - Perseus Mining Ltd (PRU.AX)
Underperformers:
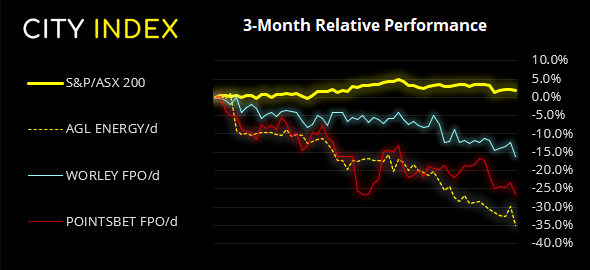
- -7.44% - AGL Energy Ltd (AGL.AX)
- -4.3% - Worley Ltd (WOR.AX)
- -4.1% - Pointsbet Holdings Ltd (PBH.AX)
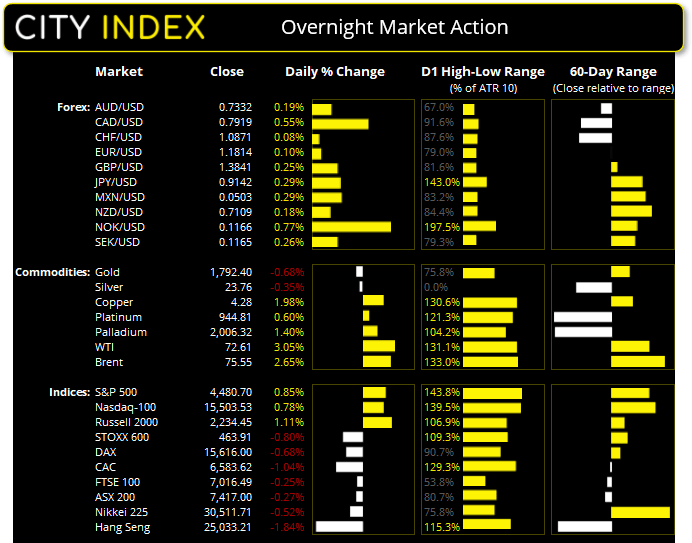
Forex: CAD flies high on firm energy prices and inflation data
Canadian inflation rocketed to a 13-year high, which is likely the last think Justin Trudeau wants to hear just days ahead of Canada’s election. Rising 4.1% YoY and 0.3% MoM, it’s the fastest rate of annualised inflation since March 2003. And the Bank of Canada’s preferred inflation gauge, trimmed mean CPI, rose to 3.4% which is its highest level in thirty years. So that, combined with higher energy prices saw CAD as the strongest major of the session.
NZ GDP kicks off data in today’s Asian session at 08:45 AEST. However, it’s a backwards looking indicator, and Q2 data doesn’t capture the extent of the lockdown parts of NZ are still in for Q3 data. Currently NZ is expected to report 2.4% growth in Q2. Still, if it comes in weak today then it only spells more trouble for Q3 data and traders will likely be tempted to offload any kiwi dollars.
And as Australia release employment data at 11:30 then there is the potential for a decent move on AUD/NZD, should their respective datasets diverge by a large enough degree. However, keep in mind that its current bearish leg looks quite extended to the downside, so the asymmetric trade may be strong AU employment and weak NZ growth. AU employment is tipped to rise to 4.9%, shed -78.5k jobs and send the participation rate down to 65.7%.
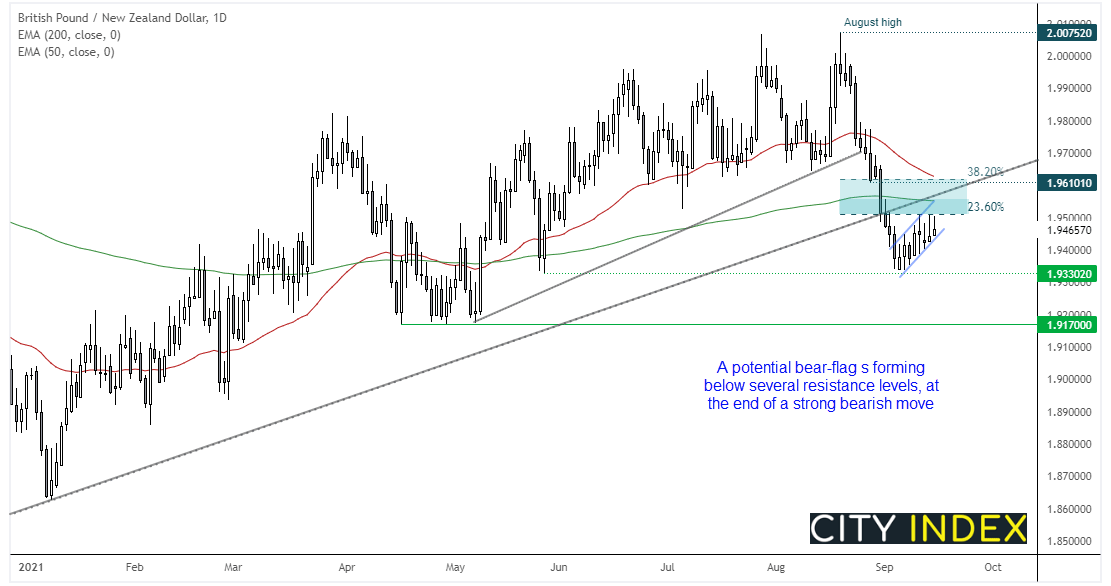
Technically, GBP/NZD remains of interest for potential bearish setups. It’s -3.6% decline from the August high broke two bullish trendlines with apparent ease and now prices are coiling up in a potential bear flag pattern. Resistance has been met at the 23.6% Fibonacci ratio to underscore a shallow retracement amidst a strong bearish trend. Furthermore, the 200-day eMA and broken trendline are also nearby for additional resistance.
USD/JPY fell to a 1-month low following weaker-than-expected inflation on Tuesday. A key focal point for dollar traders will be employment claims tonight, where an unexpected rise could weigh further on the dollar.
Learn how to trade forex
Commodities: Oil rises on falling supplies and pent-up demand expectations
Oil’s rally finally took off to see WTI rise over 2% and break above $72, after a report by IEA (International Energy Agency) stated they expect the vaccination rollout to unleash pent-up demand. Furthermore, stockpiles have dwindled due to Hurricane Ida whilst daily output from China’s oil refinery hit a 15-month low.
Bears finally took their foot off-of their bearish pedals on palladium futures, allowing the battered metal to rise for the first day in 8 sessions. Whilst there’s no obvious signs of a trough forming just yet, it sends a warning signals to bears tempted to jump in late to the party.
Up Next (Times in AEST)
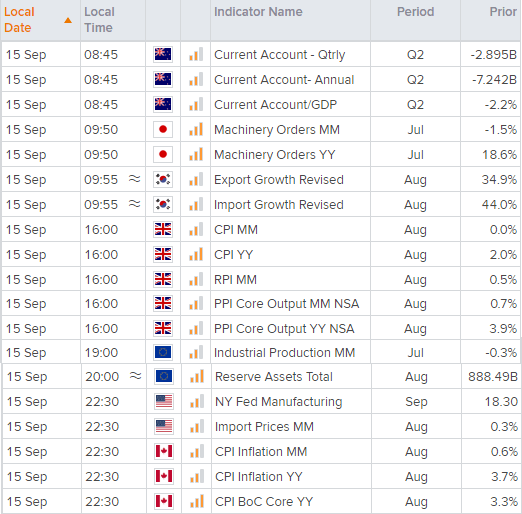
You can view all the scheduled events for today using our economic calendar, and keep up to date with the latest market news and analysis here.
How to trade with City Index
Follow these easy steps to start trading with City Index today:
- Open a City Index account, or log-in if you’re already a customer.
- Search for the market you want to trade in our award-winning platform.
- Choose your position and size, and your stop and limit levels.
- Place the trade.
Latest market news
Yesterday 03:30 PM
Yesterday 01:23 PM
Yesterday 11:00 AM
Yesterday 08:15 AM
Latest Indices articles
Yesterday 03:30 PM
April 18, 2024 04:46 PM
April 17, 2024 11:00 AM
April 16, 2024 08:00 PM