


Asian Futures:
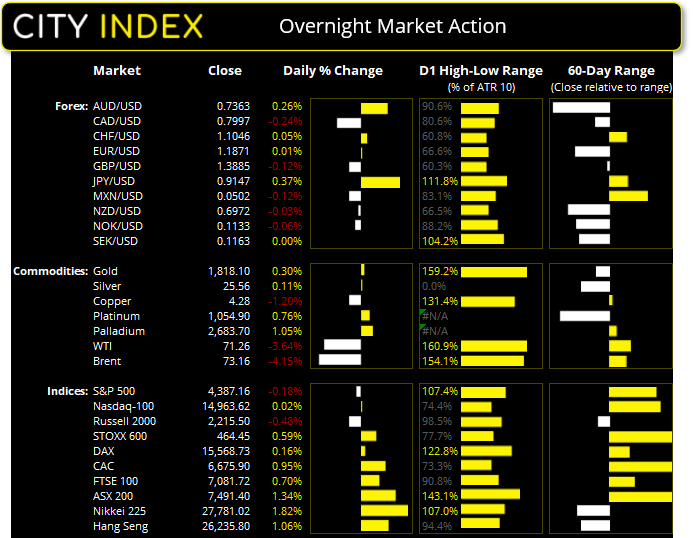
- Australia's ASX 200 futures are down -6 points (-0.08%), the cash market is currently estimated to open at 7,485.40
- Japan's Nikkei 225 futures are down -200 points (-0.72%), the cash market is currently estimated to open at 27,581.02
- Hong Kong's Hang Seng futures are down -3 points (-0.01%), the cash market is currently estimated to open at 26,232.80
UK and Europe:
- UK's FTSE 100 index rose 49.42 points (0.7%) to close at 7,081.72
- Europe's Euro STOXX 50 index rose 27.32 points (0.67%) to close at 4,116.62
- Germany's DAX index rose 24.34 points (0.16%) to close at 15,568.73
- France's CAC 40 index rose 63.14 points (0.96%) to close at 6,675.90
Monday US Close:
- The Dow Jones Industrial fell -97.31 points (-0.28%) to close at 34,838.16
- The S&P 500 index fell -8.1 points (-0.19%) to close at 4,387.16
- The Nasdaq 100 index rose 3.728 points (0.02%) to close at 14,963.62
Learn how to trade indices
ISM manufacturing softens:
ISM manufacturing eased off in July to 59.50 from 60.6 as supply bottlenecks became unstuck. It’s its third month of slower expansion over the past four since it peaked May 64.7 in March. The ‘prices paid’ index, which is a proxy for inflation also fell to 85.7 from its record high of 92.1 in June, making it’s the largest monthly decline in 16 months. Still, the headline index remains at a historically high level but its plausible to suggest the peak is in place. Perhaps inflation will turn out to be transitory after all!
Wall Street handed back early gains to see the S&P 500 and Dow Jones fall -0.18% and 0.28% respectively. Materials and energy sectors weighed on the S&P 500 and small caps were also in the red with the Russell 2000 and S&P SC600 down -0.48% and -0.73% respectively.
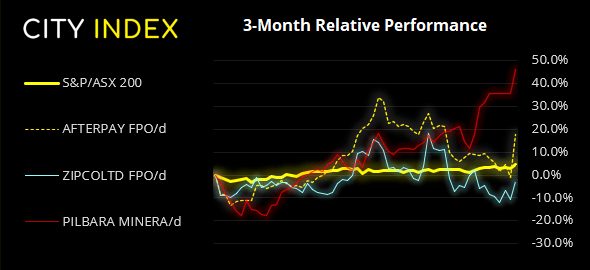
ASX 200 accelerated northwards to close to a new record high yesterday. But given the rally was fuelled mostly by Square (SQ) Inc’s plan to acquire Afterpay (APT) at the open, then a retracement towards the prior high of 7447.90 seems plausible.
ASX 200 Market Internals:
ASX 200: 7491.4 (1.34%), 02 August 2021
- Information Technology (6.54%) was the strongest sector and Energy (0.04%) was the weakest
- 11 out of the 11 sectors closed higher
- 5 out of the 11 sectors outperformed the index
- 160 (80.40%) stocks advanced, 31 (15.58%) stocks declined
- 71.36% of stocks closed above their 200-day average
- 60.3% of stocks closed above their 50-day average
- 66.33% of stocks closed above their 20-day average
Outperformers:
- + 18.8% - Afterpay Ltd (APT.AX)
- + 9.04% - Zip Co Ltd (Z1P.AX)
- + 7.63% - Pilbara Minerals Ltd (PLS.AX)
Underperformers:
- -4.35% - Mineral Resources Ltd (MIN.AX)
- -4.21% - Champion Iron Ltd (CIA.AX)
- -4.18% - Boral Ltd (BLD.AX)
Forex: AUD trades higher ahead of (potentially dovish) RBA meeting
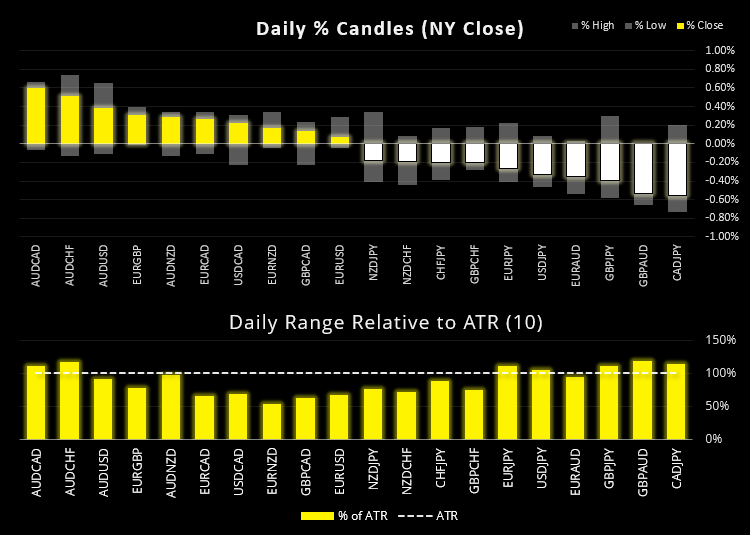
Another Fed member has begun talking-up an early taper. Christopher Waller said during an interview on CNBC that he favours ‘going early and fast’ regarding tapering, although it could go at a faster pace than last time and that he could be ready to make an announcement at the September FOMC meeting. It’s also worth noting that the September meeting takes place just after the Jackson Hole Symposium at the end of August where it’s plausible to expect the fed to announce their plan to exit QE.
The US dollar index (DXY) closed marginally above its 200-day eMA again yet printed a small, Doji inside candle to really underscore some indecision. Our bias remains bearish beneath 92.50.
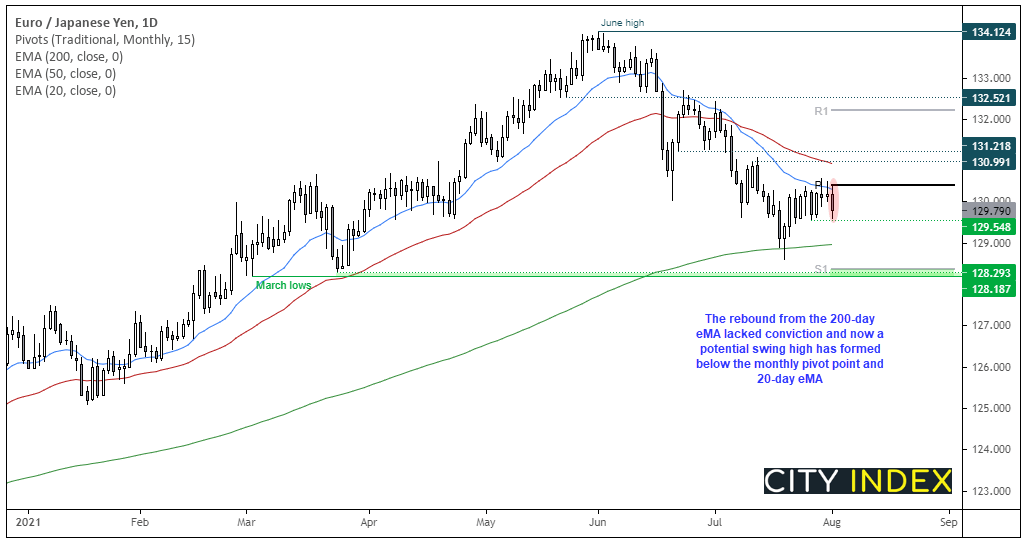
JPY was the strongest major as weaker equities and ISM saw the safety play favour the yen. With JPY back in favour we suspect EUR/JPY may be trying to carve out a swing high. An earlier bounce from the 200-day eMA failed to ‘take off’ with any momentum and now a large bearish candle has formed at the 20-day eMA and monthly pivot point. With the monthly S1 pivot sitting just above the March lows it makes a decent bearish target, should markets revert to risk-off mode with the 200-day eMA around 129 making a potential interim target. A break below 129.50 confirms a breakout.
The RBA hold their monetary policy meeting at 14:30 AEST and the expectation if for them to hold off from tapering until at least September, with the possibility they may even increase their asset purchases to more than AU $5 billion per week next month. But with such expectations in place with a heavily sold Aussie, perhaps there’s potential for a bounce unless RBA exceed dovish expectations. Australian dollar traded higher yesterday despite weaker commodity prices, lower ISM and PMI data from China, so perhaps bears are squaring up / booking profits ahead of the meeting as the
Our bias for AUD/USD remains bearish beneath 0.7415 with the potential for a run towards the 0.7250 support zone. Although an alternative view to consider over the coming day/s is if the RBA are not as dovish as expected and other Fed members become more vocal about an early taper.
We noted the potential for GBP/AUD to retrace in yesterday’s European open report, and the daily bearish engulfing candle suggests that nay now be underway. From here we’d look for support to build at or above the 0.8700 support cluster.
Learn how to trade forex
Commodities:
Oil prices fell over -3% yesterday as traders absorbed weaker manufacturing data form China and higher crude output from OPEC members. Rising cases of coronavirus across several states is also raising concerns over demand. WTI fell to 71.49 with traders now keeping a close eye on how it reacts around $70.0.
Gold prices were effectively flat but found support above the 200-day eMA and monthly pivot point.
Silver is also trading around its 200-day eMA below a cluster of resistance, so we are waiting for momentum to tip its hand for its next directional move.
Up Next (Times in AEST)
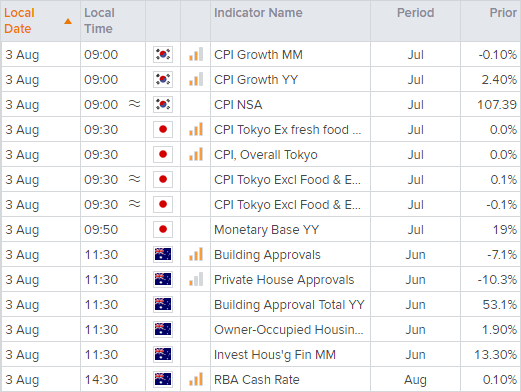
You can view all the scheduled events for today using our economic calendar, and keep up to date with the latest market news and analysis here.
How to trade with City Index
Follow these easy steps to start trading with City Index today:
- Open a City Index account, or log-in if you’re already a customer.
- Search for the market you want to trade in our award-winning platform.
- Choose your position and size, and your stop and limit levels.
- Place the trade.
Latest market news
Today 08:33 AM
Latest Indices articles
Yesterday 11:00 AM
April 16, 2024 08:00 PM
April 16, 2024 04:54 PM
April 15, 2024 06:08 AM