


Asian Futures:
- Australia's ASX 200 futures are up 2 points (0.03%), the cash market is currently estimated to open at 7,309.30
- Japan's Nikkei 225 futures are down -80 points (-0.28%), the cash market is currently estimated to open at 28,968.02
- Hong Kong's Hang Seng futures are up 61 points (0.21%), the cash market is currently estimated to open at 29,329.30
UK and Europe:
- The UK's FTSE 100 futures are down -54 points (-0.76%)
- Euro STOXX 50 futures are down -23.5 points (-0.57%)
- Germany's DAX futures are down -32 points (-0.21%)
Monday US Close:
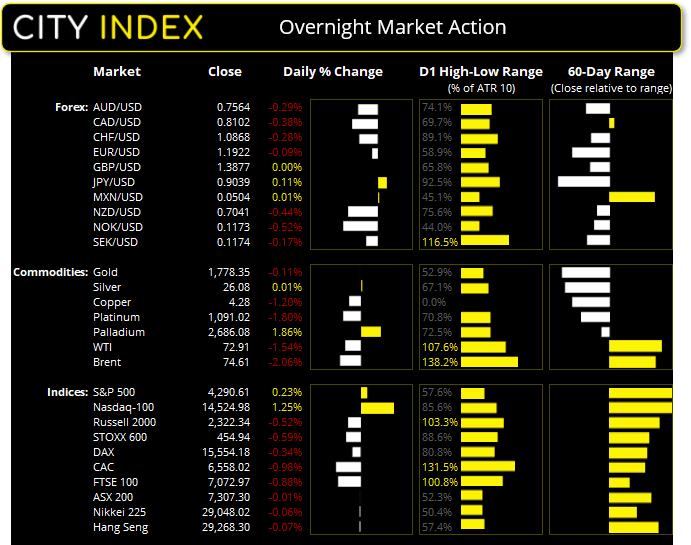
- The Dow Jones Industrial fell -150.57 points (-0.44%) to close at 342,873.27
- The S&P 500 index rose 9.91 points (0.24%) to close at 4,290.61
- The Nasdaq 100 index rose 179.796 points (1.25%) to close at 14,524.98
Learn how to trade indices
Indices:
Global equity prices reached new highs for a second consecutive session, according to the MSCI’s all country world index. It was mixed on Wall Street but the Nasdaq 100 rallied 1.2% to a new record high, although found resistance at the monthly R2 pivot level. The S&P 500 also etched a new record high but rose just 0.23%, whilst the Dow Jones closed -0.44% lower. The Russell 2000 is struggling to retest its record high and fell to a two-day low, keeping the index very much inside its three-month sideways range.
The ASX 200 continues to coil into a symmetrical triangle on the daily / four-hour chart. A rule of thumb (but by no means a strict rule) is for prices to break out of triangles in the direction of the trend, which would suggest bullish in this instance. And with global equities moving higher, perhaps it will materialise. But we should also account for end-of month and end of financial years flows which may spur pockets of volatility along the way. For now, it has found support at the 20-day eMA and a break of Friday’s high could assume a bullish breakout from the triangle. If prices can hold above 7300 early in the session it could be game on for such a move., whilst a break beneath 7219 sends a warning to the bull camp.
ASX 200 Market Internals:
ASX 200: 7307.3 (-0.01%), 28th June 2021
- Consumer Staples (1.48%) was the strongest sector and Information Technology (-2.81%) was the weakest
- 7 out of the 11 sectors closed higher
- 69 (34.67%) stocks advanced, 125 (62.81%) stocks declined
- 9 hit a new 52-week high, 1 hit a new 52-week low
- 73.37% of stocks closed above their 200-day average
- 66.83% of stocks closed above their 50-day average
- 58.79% of stocks closed above their 20-day average
Outperformers:
- + 8.16% - Redbubble Ltd (RBL.AX)
- + 6.56% - Kogan.com Ltd (KGN.AX)
- + 3.77% - Endeavour Group Ltd (EDV.AX)
Underperformers:
- -7.52% - Afterpay Ltd (APT.AX)
- -7.39% - Gold Road Resources Ltd (GOR.AX)
- -7.05% - Zip Co Ltd (Z1P.AX)
Forex:
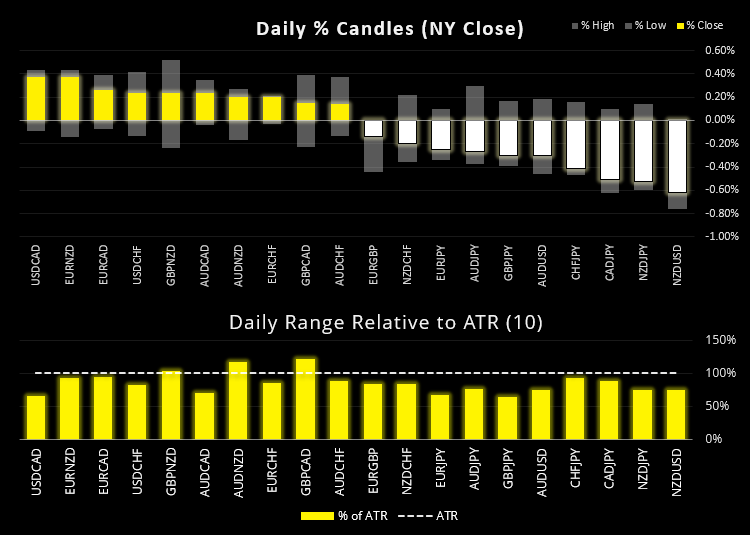
It was a pivotal day for the US dollar, with several major reversing course against last week’s direction. USD/CHF finally broke higher from compression which brings the highs just below 0.9250 into focus, then the monthly R2 pivot at 0.9260. Our near-term bias remains bullish above 0.9142 but. Given the impulsive nature of the prior rally, we suspect this could be part of a larger move.
AUD and NZD show signs of topping out after yesterday’s bearish candles confirmed Friday’s bearish pinbars. However, take note of their respective 200-day eMA’s which are nearby as potential support levels.
JPY and GBP were the strongest major currencies yesterday, whilst NZD and CHF were the weakest. The Kiwi dollar also remains the weakest currency month-to-date.
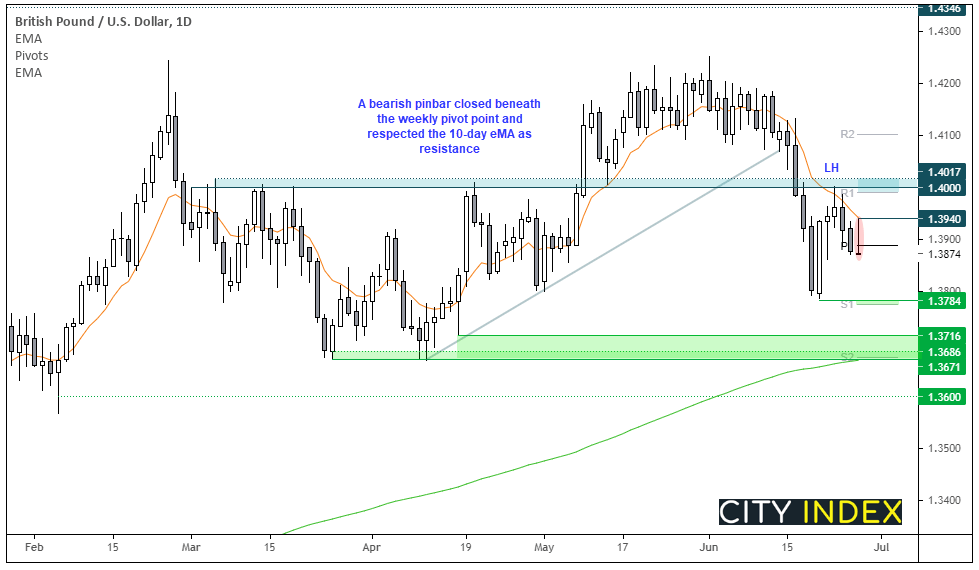
GBP/USD looks like its preparing for its next drop lower, judging from the daily trend structure. A lower high formed last week at 1.4000 then printed two down-days before yesterday’s bearish pinbar. Moreover, yesterday’s high found resistance at the 10-day eMA then closed below the weekly pivot. The next logical support level (or target for bears) is around the 1.3800 handle, which is just above a cycle low and the weekly S1. Further out the April lows come into focus, although there are several potential support levels between 1.3670 – 1.3715 including the 200-day eMA, swing lows and weekly S2.
Learn how to trade forex
Commodities:
The front-month WTI prices printed notable reversal candles at their highs yesterday, ahead of Thursday’s OPEC+ meeting. WTI futures produced a bearish engulfing candle after touching a fresh 2.5 year high in yesterday’s Asian trade, although found support at the 10-day eMA. This could simply be part of a pause in trend ahead of the OPEC+ meeting, but markets will want to find out if they simply reveal a modest production cut (which probably won’t negatively impact the trend too much) or something a bit more aggressive which could spark a deeper retracement from current heights.
Gold and silver remain range bound, but platinum printed a bearish two-bar reversal and closed back beneath its 200-da eMA after failing to break back above the March low. So, we are now seeing signs that its swing high may be in place.
Soybean futures bounced from the 1289 support level flagged in yesterday’s Asian Open report, but we’ll continue to see if this key level can break to signal further downside as part of larger bearish move.
Up Next (Times in AEST)
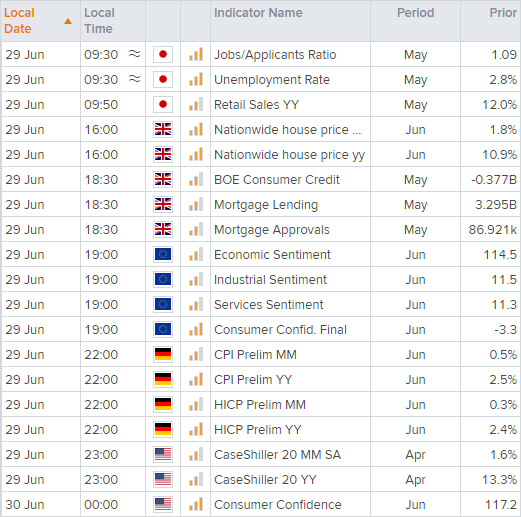
You can view all the scheduled events for today using our economic calendar, and keep up to date with the latest market news and analysis here.
How to trade with City Index
Follow these easy steps to start trading with City Index today:
- Open a City Index account, or log-in if you’re already a customer.
- Search for the market you want to trade in our award-winning platform.
- Choose your position and size, and your stop and limit levels.
- Place the trade.
Latest market news
Latest Indices articles

April 17, 2024 11:00 AM
April 16, 2024 08:00 PM
April 16, 2024 04:54 PM