


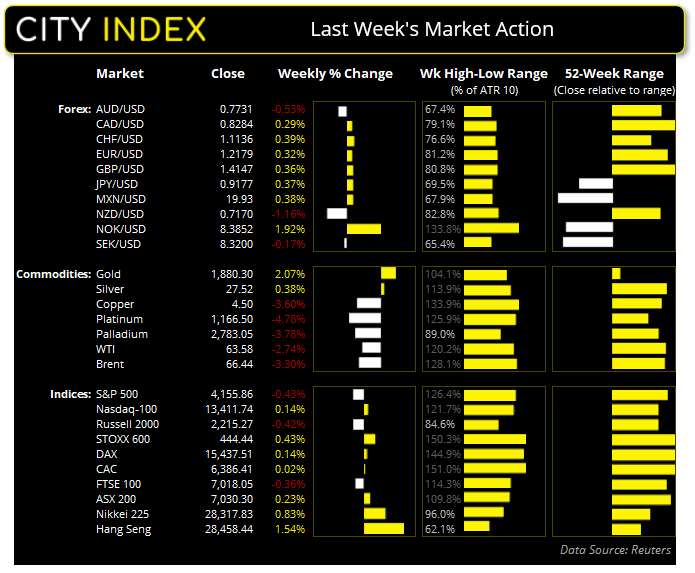
Asian Futures:
- Australia’s ASX 200 futures fell -5 points (-0.071%), the cash market is currently estimated to open at 7025.3
- Japan's Nikkei 225 futures have risen 40 points (0.14%), the cash market is currently estimated to open at 28357.83
- Hong Kong's Hang Seng futures are down -53 points (-0.19%), the cash market is currently estimated to open at 28405.44
European Friday close:
- UK's FTSE 100 index fell -1.74 points (-0.02%) to close at 7,018.05
- Europe's Euro STOXX 50 index rose 25.87 points (0.65%) to close at 4,025.78
- Germany's DAX index rose 67.25 points (0.44%) to close at 15,437.51
- France's CAC 40 index rose 42.83 points (0.68%) to close at 6,386.41
US Friday close:
- The Dow Jones rose 123.74 points (0.36%) to close at 34,207.84
- The S&P 500 fell -3.26 points (-0.08%) to close at 4,155.86
- The Nasdaq 100 fell -82.356 points (-0.61%) to close at 13,411.74
Learn how to trade indices
Plenty of chop across indices:
It could well be the time of the year, but equity markets are chopping around and clearly not in a trending phase. The fact we are now approaching month-end flows could mean more of the same (more chop, failed breakouts and no sustainable trend).
European indices such as the STOX 50 and DAX have produced a couple of hammers around their 10-week eMA, yet the ‘buying tails’ (lower wicks) have not been coupled with a break to new highs. So, the daily charts have essentially been ricocheting up and down over a three-week, ill-defined range. So counter-trend bears may want to seek evidence of exhaustion near recent highs, whilst bulls could wait for a clear breakout.
The ASX 200 closed the week with a Doji candle above its 10-week eMA. The monthly candle is also on track for a Doji, so it’s not exactly riveting stuff, if trend trading is your thing. Friday closed with a Spinning Top Doji beneath Thursday’s, elongated bearish candle. So there is risk of another dip lower should the 7066 (Thursday’s open and high) or the 7083 swing high hold, and a break below 7,000 confirms a bearish hammer on the four-hour chart.
ASX 200 Market Internals:
ASX 200: 7030.3 (0.15%), 23 May 2021
- Healthcare (1.77%) was the strongest sector and Energy (-2.02%) was the weakest
- 8 out of the 11 sectors closed higher
- 6 out of the 11 sectors outperformed the index
- 107 (53.50%) stocks advanced, 72 (36.00%) stocks declined
- 65% of stocks closed above their 200-day average
- 36% of stocks closed above their 20-day average
Outperformers:
- + 15.8% - EML Payments Ltd (EML.AX)
- + 6.32% - A2 Milk Company Ltd (A2M.AX)
- + 5.36% - Webjet Ltd (WEB.AX)
Underperformers:
- -14.3% - Kogan.com Ltd (KGN.AX)
- -6.53% - Nufarm Ltd (NUF.AX)
- -5.13% - Appen Ltd (APX.AX)
From the weekly COT report (Commitment of Traders):
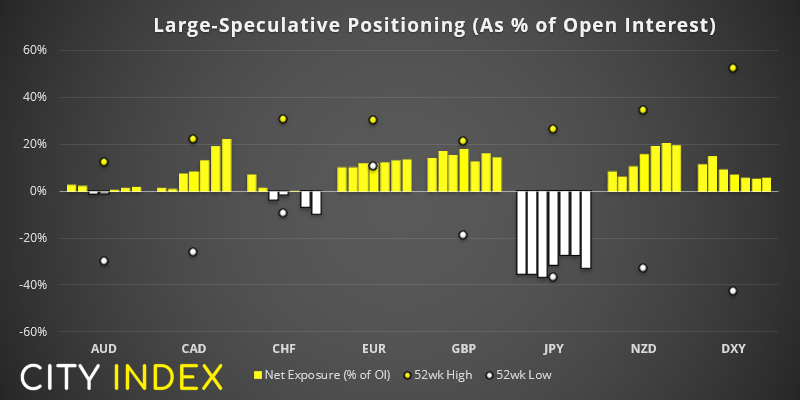
As of Tuesday 18th May 2021:
Traders increased their net-long exposure to Canadian dollar futures to their highest level since November 2019. Gross longs increased by 2.7k contracts and shorts were trimmed by -4.8k contracts, so the rise in net-long exposure ticks all the boxes of a healthy uptrend. However, net and gross-long positioning is also approaching extremer levels and it Z-score is now +2.6 standard deviations.
- Large speculators increased their long exposure to the euro to a 10-week high.
- Traders are their most bearish on the Swiss franc since January 2020.
- Metal traders trimmed net-long exposure to copper futures. They also trimmed long-exposure to silver futures for the first week in seven. Net-long exposure for gold futures however has risen to a three-month high.
Is the dollar’s downside now a bit stretched?
There are some signs across a few majors that the wea dollar play is potentially overcooked. The exceptions are USD/CAD and USD/CHF, although downside momentum on theses pairs is waning a little. That is not enough to be long, but it could mean that if bullish momentum broadly returns for the dollar we’d expect these to appreciate the least, so bears may want to step aside from such pairs under this scenario and instead wait for sentient to turn against the dollar again. Yet if we look elsewhere, there are signs that the dollar may show some signs of strength.
EUR/USD produced a weekly bearish hammer, and its high stalled at the February high of 1.2242. Given the two daily reversal patterns at the same level (2x dark cloud covers) then we are wary that the dollar’s downside is stretched over the near-term.
GBP/USD also produced a weekly hammer at the February high to warn of overextension of its bullish run.
If we switch to the US dollar index, whilst a bullish hammer did not materialise, it closed back above 90.0 after failing to break beneath the February low. Traders remain net-long, so we do see its potential to rise, even if only on a technical perspective. But, of course, it all comes down to the timing.
The Australian dollar has been making hard work of any gains, and the daily chart is producing something along the line of a head and shoulders top. It closed lower for a second consecutive week and, whilst the weekly chart doesn’t reveal anything technically compelling, the monthly chart has failed to break above its 200-bar eMA over the past five months. Is the mighty Australian dollar carving out a slow and painful top? It is certainly not a consensus view, especially with so much hype surrounding a commodities boom, but the consensus can be wrong at turning points.

And finally, USD/JPY is holding above its 50-day eMA. Given this dynamic support level held earlier in May ahead of a in 1.15% rally in a single session, we’re keeping a close eye to see if it is ready to repeat history. A slight concern is that Friday saw a breach of trendline support, although it’s interesting to note that prices held above the Bullish marabuzo low. So we find ourselves at a pivotal level at the start of the week; should bullish momentum break above Friday’s high then bulls could assume its correction was over, whilst a break beneath 108.69 invalidates the trendline and assumes a trend reversal.
Learn how to trade forex
Commodities:
Gold closed to its highest level since January, although a second Doji over three days at its highs warns of trend exhaustion. Still, even if prices were to drop from current levels the trend remains bullish on the daily chart above 1808. So, unless any retracement is seen on high volatility, gold remains favourable for bullish setups ion our view.
Silver remains in the bullish channel although Friday’s bearish outside candle sows another shakeout was underway. Yet whilst the corrective phase continues, so does our bullish bias. We just haven’t seen solid evidence of a trough yet.
Platinum finally closed beneath its daily trendline support, which brings the 1100 lows into focus from a technical perspective.
Up Next (Times in AEST)
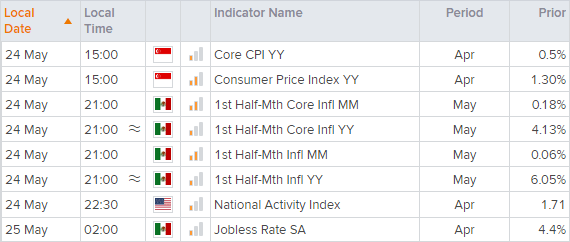
You can view all the scheduled events for today using our economic calendar, and keep up to date with the latest market news and analysis here.
Latest market news
Yesterday 08:33 AM
Latest Indices articles

April 17, 2024 11:00 AM
April 16, 2024 08:00 PM
April 16, 2024 04:54 PM