


This article is a complement to our full 2020 Market Outlook report [link] - please download the full report for more insight into our views for major markets this year, including bold predictions from the research team!
Kelvin Wong, CFTe
Chief Technical Strategist
What a year it has been for Asian equities!
The most populated region and highest concentration of export-dependent economies got hit by supply chain disruption from the U.S-China trade war. Also, Hong Kong, a major financial centre that operates as a key conduit for capital flows between the East and West has added another element of uncertainty to the macro jigsaw puzzle. Mass anti-government demonstrations have erupted in Hong Kong since June, and lately, they’ve intensified into violent street protests over the alleged political interference from China into Hong Kong that violated the “One Country, Two Systems” policy.
The U.S. Congress has shown its support for Hong Kong anti-government protestors and President Trump has signed the Hong Kong Human Rights and Democracy Act, opening the door to sanctions on Chinese and Hong Kong officials deemed responsible for human right abuses in Hong Kong. China has vowed to retaliate, complicating the ongoing US-China trade deal negotiations.
Despite all these uncertainties, Asian equities in general managed to record a decent gain of 12% so far as of the end of November 2019 (as measured by the MSCI Asia Ex-Japan Index), combined with a 19% rally seen in Japan’s Nikkei 225.
As we gaze to our 2020 crystal ball, we highlight several macro themes that can play out in order guide our goalpost and equity selections:
- There are some signs of willingness from the US and China to deescalate the ongoing trade war via “piecemeal mini trade deals” with a “Phase One” deal potentially on the horizon. However, we still need to ponder the possibility of a Phase Two or even Phase Three deal and the potential for China’s administration to play the “long game” by dragging the next round of trade negotiation talks out until the U.S. presidential election concludes in Nov. 2020.
- Thus, 2020 will bring an element of uncertainty over economic growth that could see a combination of fiscal and further expansionary monetary policies from key Asian central banks, the Bank of Japan (BOJ) and the People’s Bank of China (PBoC).
- Additional “liquidity injections” could provide a floor to absorb any adverse shocks from the U.S-China trade war headwinds. Also, valuation is more attractive in Asian equities: an average price to earnings (P/E) ratio of 16 compares favourably to a P/E ratio of 21 in U.S. equities based on data as of the end of November 2019.
- Thus, we favour high-dividend yielding and consumer service/discretionary plays, as well as real estate investment trusts, in order to capitalize on a low yield environment as dovish central bank policies meet a mix of expansionary fiscal policies to cushion any negative sentiment from the prolonged US-China trade war.
NetEase Inc (NTES) - Riding the esports and online gaming up cycle wave
click to enlarge chart
- NetEase Inc, a China-based internet technology company listed on the Nasdaq, develops and operates online PC and mobile games.
- The rise of global esports and online gaming industry in the last five years has been meteoric, with total revenue for esports expected to hit US$1.1 billion in 2019, up 27% from 2018 according to a Reuters report. NetEase a leading player is set to ride and optimise on this rapidly-growing industry.
- NetEase is one the of top two PC and mobile games publisher in China, behind Tencent. Total revenue in China’s online gaming industry is expected to hit RMB339 billion in 2019. In terms of valuation, NetEase is considered more attractive with a current P/E (LTM) ratio at 14.33 versus 33.15 for Tencent according to data from Refinitiv.
- NetEase has started to reduce its reliance on the China market to hedge against regulatory headwinds where overseas game revenue reached a record high in Q3 2019, around a 10% share of total revenue.
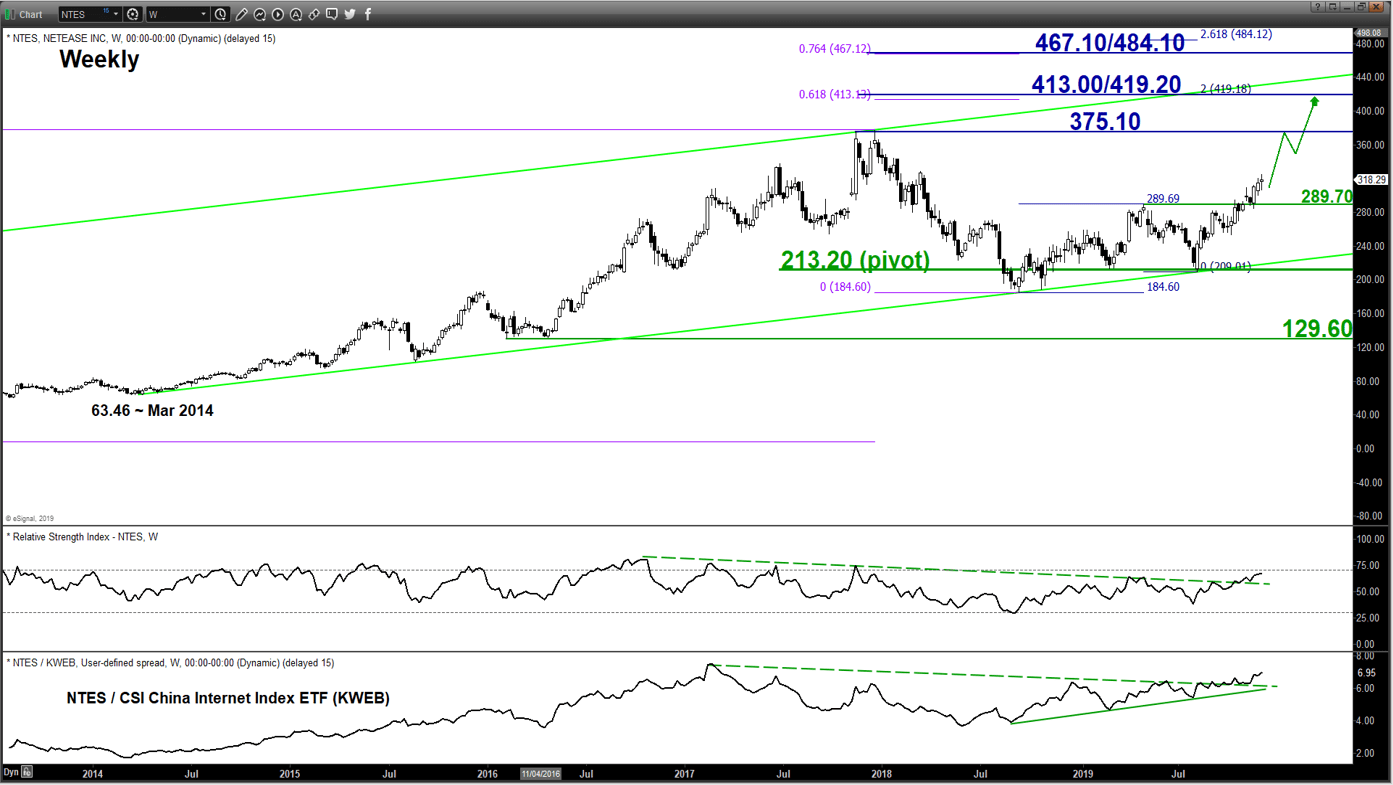
- Technically, the share price of NetEase is still evolving within a major uptrend phase in place since March 2014 with key support at 213.20. Its relative strength chart plotted against its industry represented by the CSI China Internet Index ETF suggests outperformance of NetEase.
- Thus, NetEase may see further potential upside to retest its current all-time area of 375.10 printed in Nov/Dec 2017 before targeting the next resistance at 413.00/419.20.
Alibaba Group (BABA) – Benefiting from China’s resilient consumers & expansion into Southeast Asia
click to enlarge chart
- Alibaba Group is a Chinese multinational conglomerate holding company that specializes in e-commerce, electronic payment services and cloud computing services. Its shares are dual listed on the Nasdaq and most recently on the Hong Kong Stock Exchange on 26 Nov 2019.
- Alibaba has around a 75% market share of China’s e-commerce revenue and according to iResearch, the gross merchandise value (GMV) of China’s e-commerce market is expected to continue to rise in 2020 to RMB 11.3 trillion, albeit at a slower growth rate of 16.1% y/y versus an average of 27.6% y/y seen in the past three years.
- Alibaba also stands to benefit from a resilient services sector in China despite the ongoing US-China trade tension with the Caixin China General Services PMI rising to a 7-month of 53.5 as of November 2019.
- Expansion into Southeast Asia’s growing e-commerce market via its acquisition of Lazada Group in 2018 has started to bear fruit and allows diversification of Alibaba’s revenue streams. In the recent Singles Day online shopping event on 11 November, Lazada received a record of 3 million orders in just the first 60 minutes of the event.
- In terms of valuation, Alibaba is considered attractive with a current P/E ratio (LTM) ratio of 23.52 versus its peers (Amazon.com at 79.00 and JD.com at 90.11) according to data from Refinitiv.
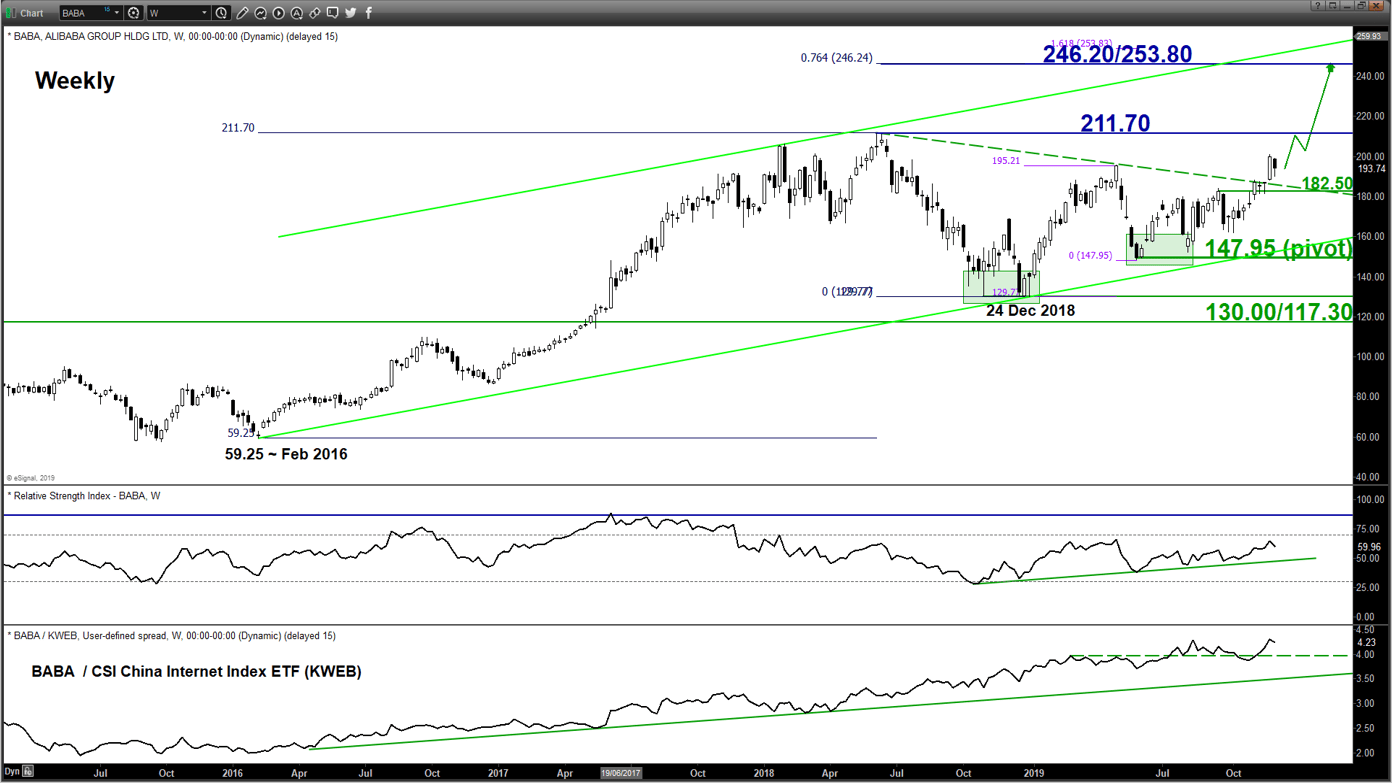
- Technically, the share price of Alibaba has just staged a bullish breakout from a medium-term descending resistance from its current all-time high of 211.70 printed in June 2018. Its major uptrend in place since the February 2016 low of 59.25 remains intact with key support at 147.95 for a potential up move to retest 211.70 before targeting the next resistance zone at 246.20/253.80.
- Also, its relative strength chart plotted against its industry represented by the CSI China Internet Index ETF supports outperformance of Alibaba in 2020.
CapitaLand Mall Trust (C38U SGX) – Defensive play that benefit from low interest rates
click to enlarge chart
- CapitaLand Mall Trust (CMT) is the largest retail REIT in Singapore listed on the Singapore Exchange.
- CMT is a stable dividend play as it must pay out at least 90% of distributable income every quarter to shareholders to qualify for tax transparency.
- CMT has a 2-year CAGR of 4% on its DPU (Distribution Per Unit) and is considered one of the faster growing Singapore REITs. It compares favourably to the 1.75% yield on the 10-year Singapore government bond. Given external uncertainties from trade tensions are expected to linger on and interest rates are likely to remain low at least through H1 2020, CMT is considered as a “safe haven” due to stable DPU payouts and could see its valuation rise further.
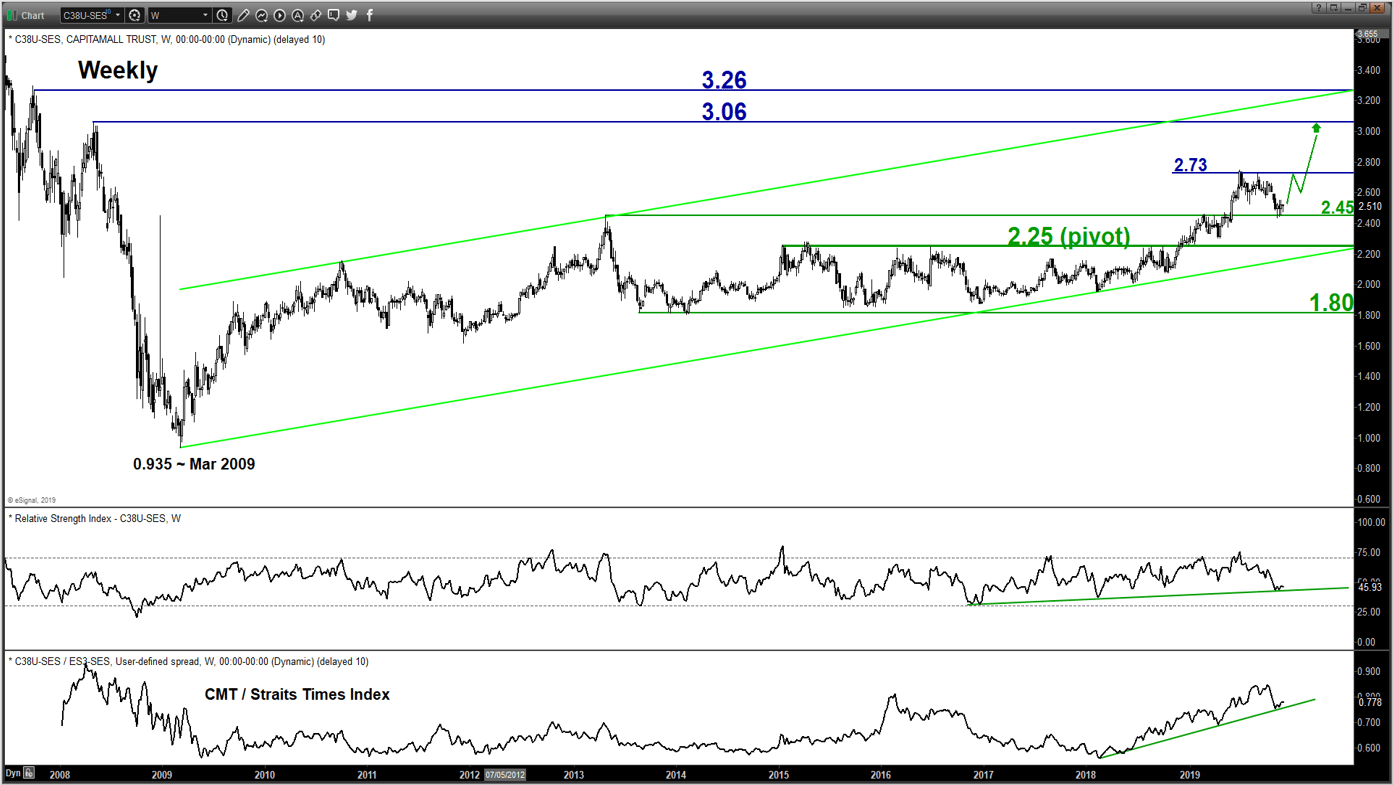
- Technically, the share price of CMT has resumed its long-term secular up move after a bullish breakout on December 2018 from a 5-year basing configuration in place since April 2013. Key support rests at 2.25 for a potential further impulsive up move sequence to retest its 52-week high area at 2.73 before targeting the next resistance at 3.06.
- In addition, the relative strength chart of CMT against the FTSE Straits Times benchmark index points to outperformance in CMT.
Keyence Corp (6861 TSE) – 5G network & big data beneficiary
click to enlarge chart
- Keyence Corp is a Japan-based manufacturing company that is engaged in the development and sale of automatic equipment such as automation sensors.
- The demand for automation sensors will likely increase due to an increase in data transactions with the emergence of 5G networks. Its 50%+ operating margin should allow Keyence to be in a leading position versus its competitors.
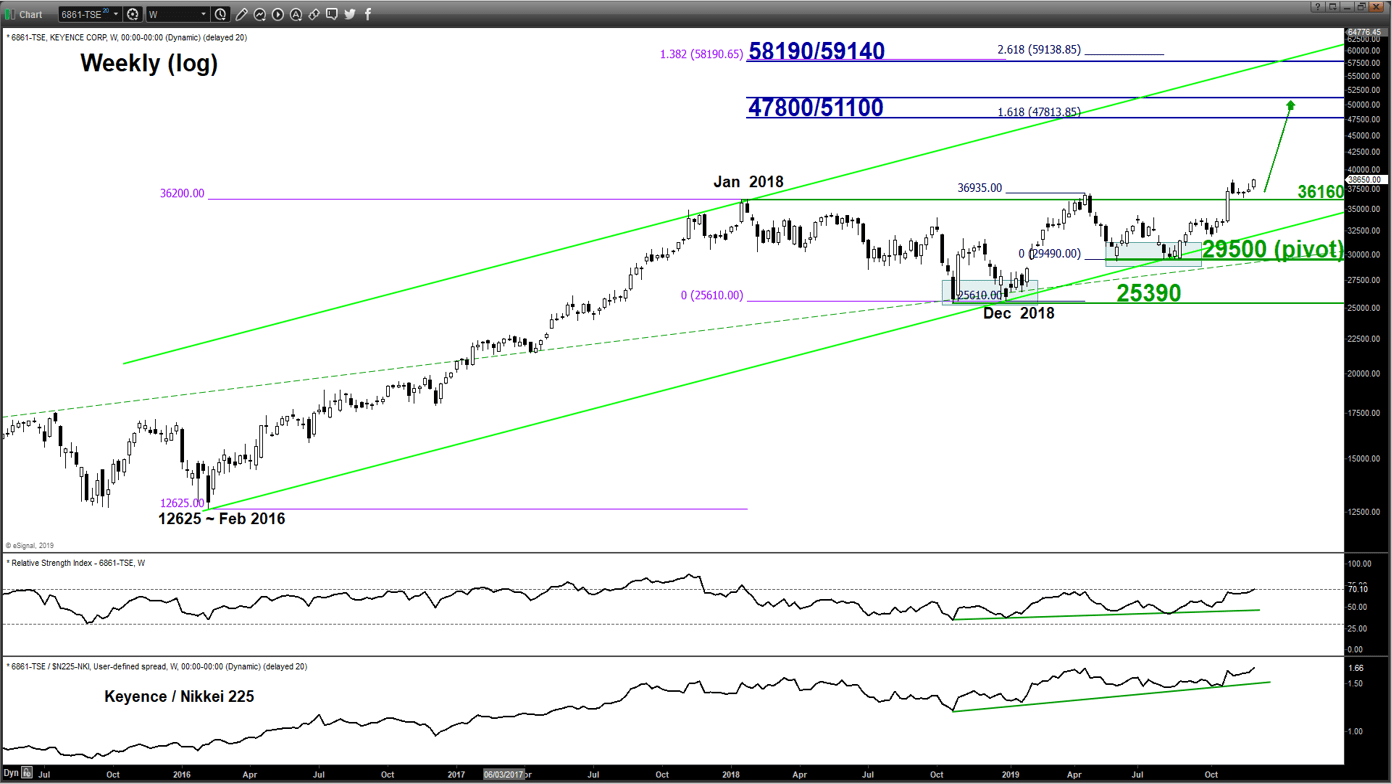
- Technically, the share price of Keyence has staged a breakout above a 10-month “Cup & Handle” bullish continuation configuration within its major uptrend phase in place since the February 2016 low of 12625. Key support rests at 29500 for a further potential up move to target the next resistance zone at 47800/51100.
- In addition, the relative strength chart of Keyence against the Nikkei 225 benchmark index suggests outperformance of Keyence in 2020.
Charts are from eSignal
Latest market news
Today 08:33 AM


