


May 26, 2022 4:42 PM
As Shanghai begins to reopen after recent lockdowns, manufacturing activity in China is likely to pick up again. (Markets will see how much damage was done when China releases its PMI data at the beginning of June). This is likely to mean more demand for commodities, and as a result, possible higher prices for commodity currencies. NZD/USD and AUD/USD have reached key Fibonacci retracement levels on the weekly timeframe and held thus far. Does this mean that they are likely to reverse?
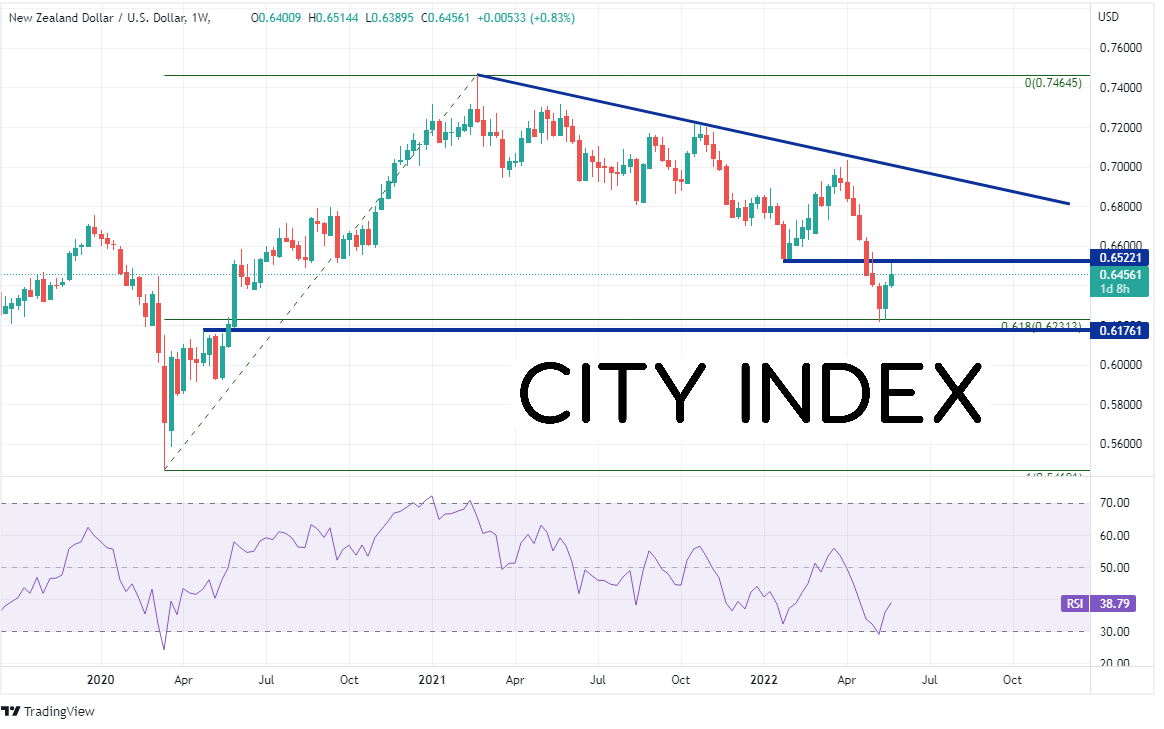
NZD/USD reached a pandemic low in March 2020 of 0.5469. The pair then made an aggressive bid higher into February 2021 and reached a high of 0.7465. Since then, the pair has been pulling back and after 7 consecutive weeks of declines, it finally reached the 61.8% Fibonacci retracement from the March 2020 lows to the February 2021 highs near 0.6231 and held. Last week, NZD/USD formed a bullish engulfing candle on the weekly timeframe and the pair is continuing higher this week. First resistance is at the lows from the week of January 24th at 0.6574 and then up to the highs of the week of April 4th and the downward sloping trendline near 0.7034. Support is at the recent lows near the previously mentioned 61.8% Fibonacci retracement at 0.6399. Below there is some minor support from April 2020 at 0.6176.
Source: Tradingview, Stone X
Trade NZD/USD now: Login or Open a new account!
• Open an account in the UK
• Open an account in Australia
• Open an account in Singapore
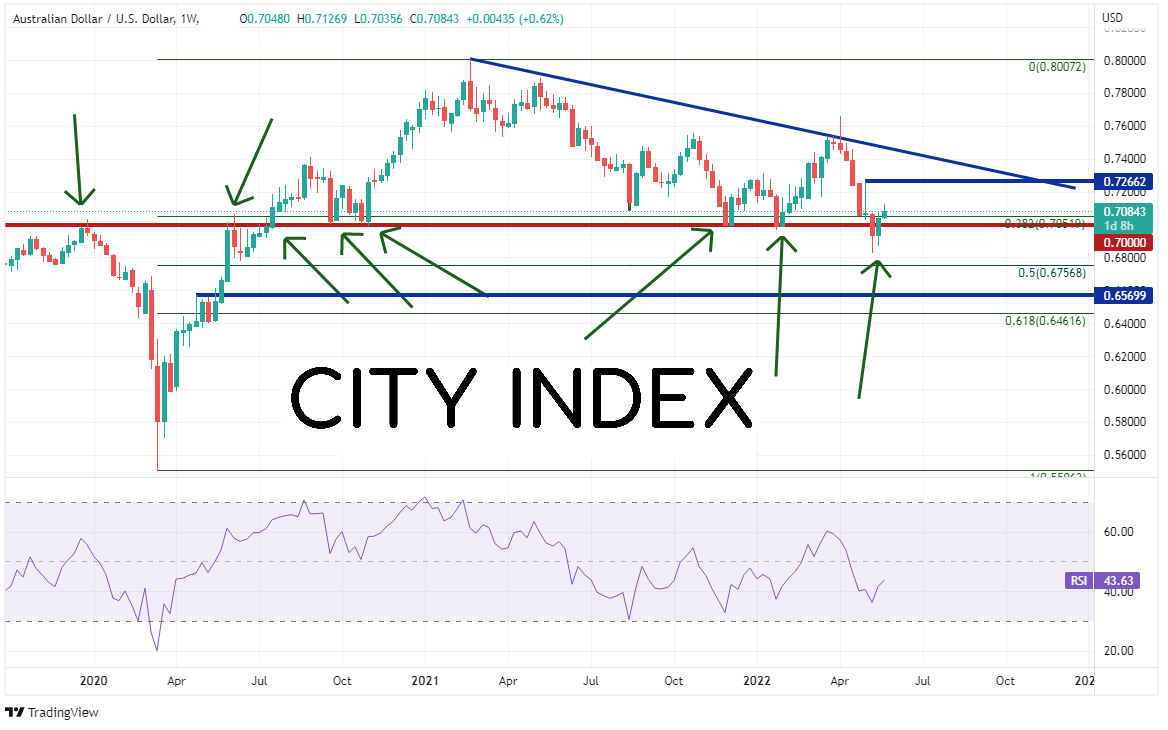
AUD/USD fell to a pandemic low in March 2020 of 0.5506. As with the Kiwi, the Aussie vs the US Dollar made a high print in February 2021 of 0.7870 and has been pulling back since. However, AUD/USD only pulled back to the 38.2% Fibonacci retracement level from the lows of March 2020 to the highs of February 2021,near 0.7050. The psychological round number support level of 0.7000 may be a more important number to watch, as that level has acted as support or resistance over the past several years. Price reached a low of 0.6828 during the week of May 9th and bounced. First resistance is at the highs from the week of May 2nd near 0.7266 and then the downward sloping trendline dating to the February 2021 highs near 0.7450. First support is at the recent low of 0.6828, then the 50% retracement level from the March 2020 lows to the February 2021 highs at 0.6570.
Source: Tradingview, Stone X
Trade AUD/USD now: Login or Open a new account!
• Open an account in the UK
• Open an account in Australia
• Open an account in Singapore
NZD/USD and AUD/USD have hit key Fibonacci retracement levels and held. Will the pairs now being to move higher in the longer-term? The answer may be dependent on how quickly China can reopen Shanghai and the rest of the country after restrictions and lockdowns due to Covid.
Learn more about forex trading opportunities.


