


October 21, 2019 2:15 PM
Another look at the US Dollar
With no economic data out from the US today, the markets remain quiet as we await news regarding whether a Meaningful Vote on Brexit out of the UK could still take place tomorrow. However, we have the ever-looming US-China trade negotiations where headlines rule, as well as the possibility that the USMCA deal make be voted on as soon as this week. In addition, later today the market will know the results of the elections in Canada. Any and all of these can move the US Dollar significantly, so let’s look at where the US Dollar Index and where it could go.
On a weekly timeframe, the DXY has been in a rising wedge since the beginning of 2018. Last week, price finally broke lower out of the wedge and closed at the weeks low near 97.14. A retest of the upward sloping trendline of the rising wedge is near 97.60. The target for the breakdown from the wedge is a 100% retracement of the wedge, which is 88.42, however remember that we are looking at a weekly time frame and that nothing moves in a straight line, so this probably won’t happen quickly. The first target on the downside is the 38.2% Fibonacci retracement level of the week of Feb 12th, 2018 lows to the week of the September 30th highs at 95.36.
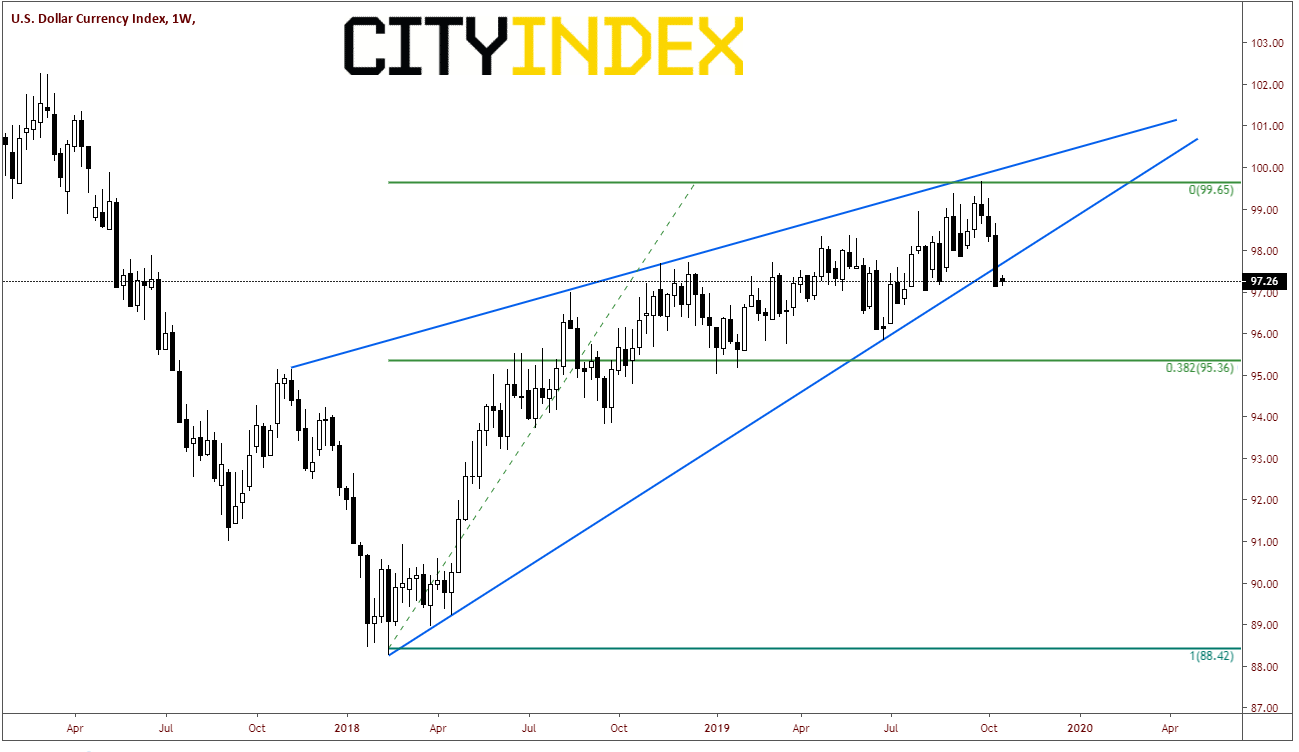
Source: Tradingview, City Index
On a daily timeframe, the index has been in an upward sloping channel since June 2018. However, since May of this year, price has been trading in a rising wedge up to the top of the channel, and broke lower out of the wedge on October 15th. The US Dollar Index has not looked back and is currently trading near the 127.2% Fibonacci extension from the June 25th low to the September 30th high. Also notice that although not oversold, the RSI is at the lowest point it has been since formation the channel. As mentioned on the weekly timeframe, the target for the breakdown of a descending wedge is a 100% retracement of the wedge, which is this case is 95.85.
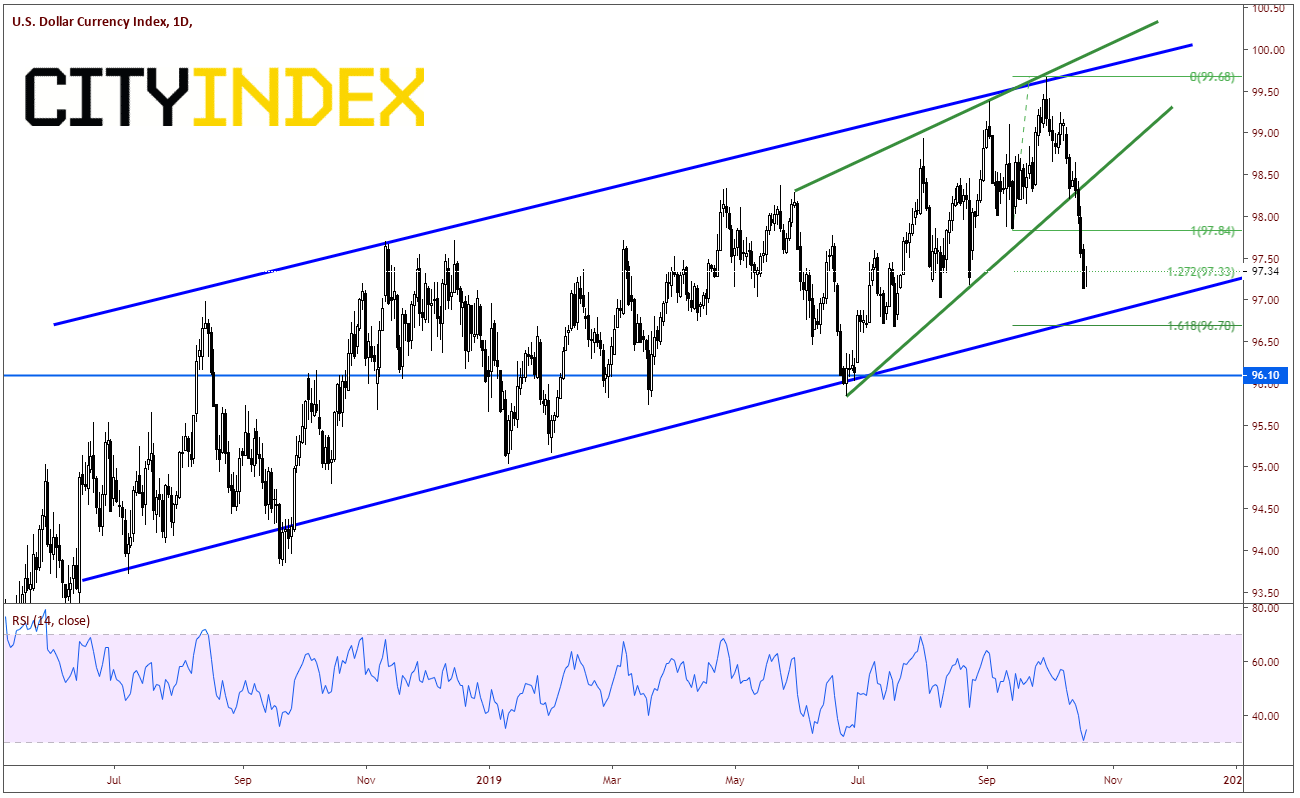
Source: Tradingview, City Index
On a 240-minute timeframe, DXY has halted at the support zone we have been highlighting from 97.03 to 97.18. Price is consolidating just above these levels, as the RSI unwinds from oversold conditions.
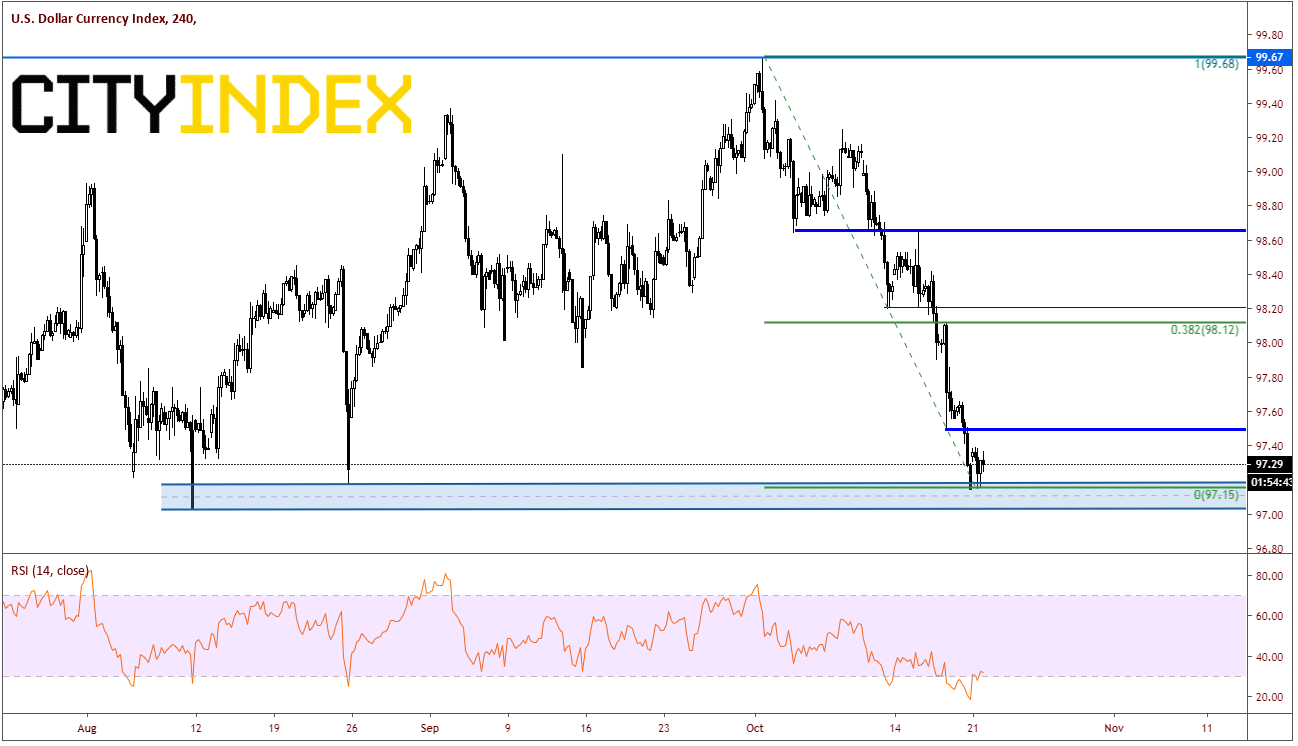
Source: Tradingview, City Index
First resistance is prior lows near 97.50 and the weekly trendline noted above at 97.60. Next resistance level is the 38.2% retracement level from the October 1st highs to today’s lows and prior lows at 98.10/98.20. Support at 95.87, which is prior lows and the target for the descending wedge on the daily.
Latest market news
Today 11:14 AM
Today 08:28 AM
Yesterday 03:30 PM
Latest Dollar articles
April 23, 2024 11:09 PM
April 18, 2024 06:20 AM
February 16, 2024 11:30 AM
February 7, 2024 03:30 PM