Anglo still top mining share as sector sells off
After some UK-listed mining shares rallied by triple-digit percentages over the last three months, we ought to expect more sessions like Monday’s. The FTSE 100’s […]
After some UK-listed mining shares rallied by triple-digit percentages over the last three months, we ought to expect more sessions like Monday’s. The FTSE 100’s […]
After some UK-listed mining shares rallied by triple-digit percentages over the last three months, we ought to expect more sessions like Monday’s.
The FTSE 100’s top miners lost some 3%-7% on Monday, softening the benchmark for the third day in a row.
For context though, Rio, BHP and Randgold had galloped some 40% ahead in the quarter to date, whilst Anglo and Glencore were among blue-chip miners to surge 100%-plus in step with mean reversion of metals prices from five-year lows in August.
The market has a choice of ‘triggers’ to account for the slippage this week: the Bank of Japan may be pressured to act again, the Federal Reserve will publish its latest thoughts (but probably won’t act), and the first 2016 GDP figures will be unveiled in the States, Europe, and the UK.
On top of that, all but one of the miners above are exposed to steel, and Australia’s decision overnight—finally—to impose duties on ‘certain types’ of Chinese steel to protect domestic producers from alleged dumping, looks ineffectual.
After China’s official Iron & Steel Association (CISA) last week announced a record 70.65 million tonne production in March, with rising prices encouraging idled capacity back online, no one expects the global glut to subside anytime soon.
Hence profit taking, and given likely cross-market volatility close to and during the week’s risks events, selling should continue in the near term.
Weekly momentum and price performance readings show that investors have now bid Anglo well above FTSE 350 Mining Index rivals.
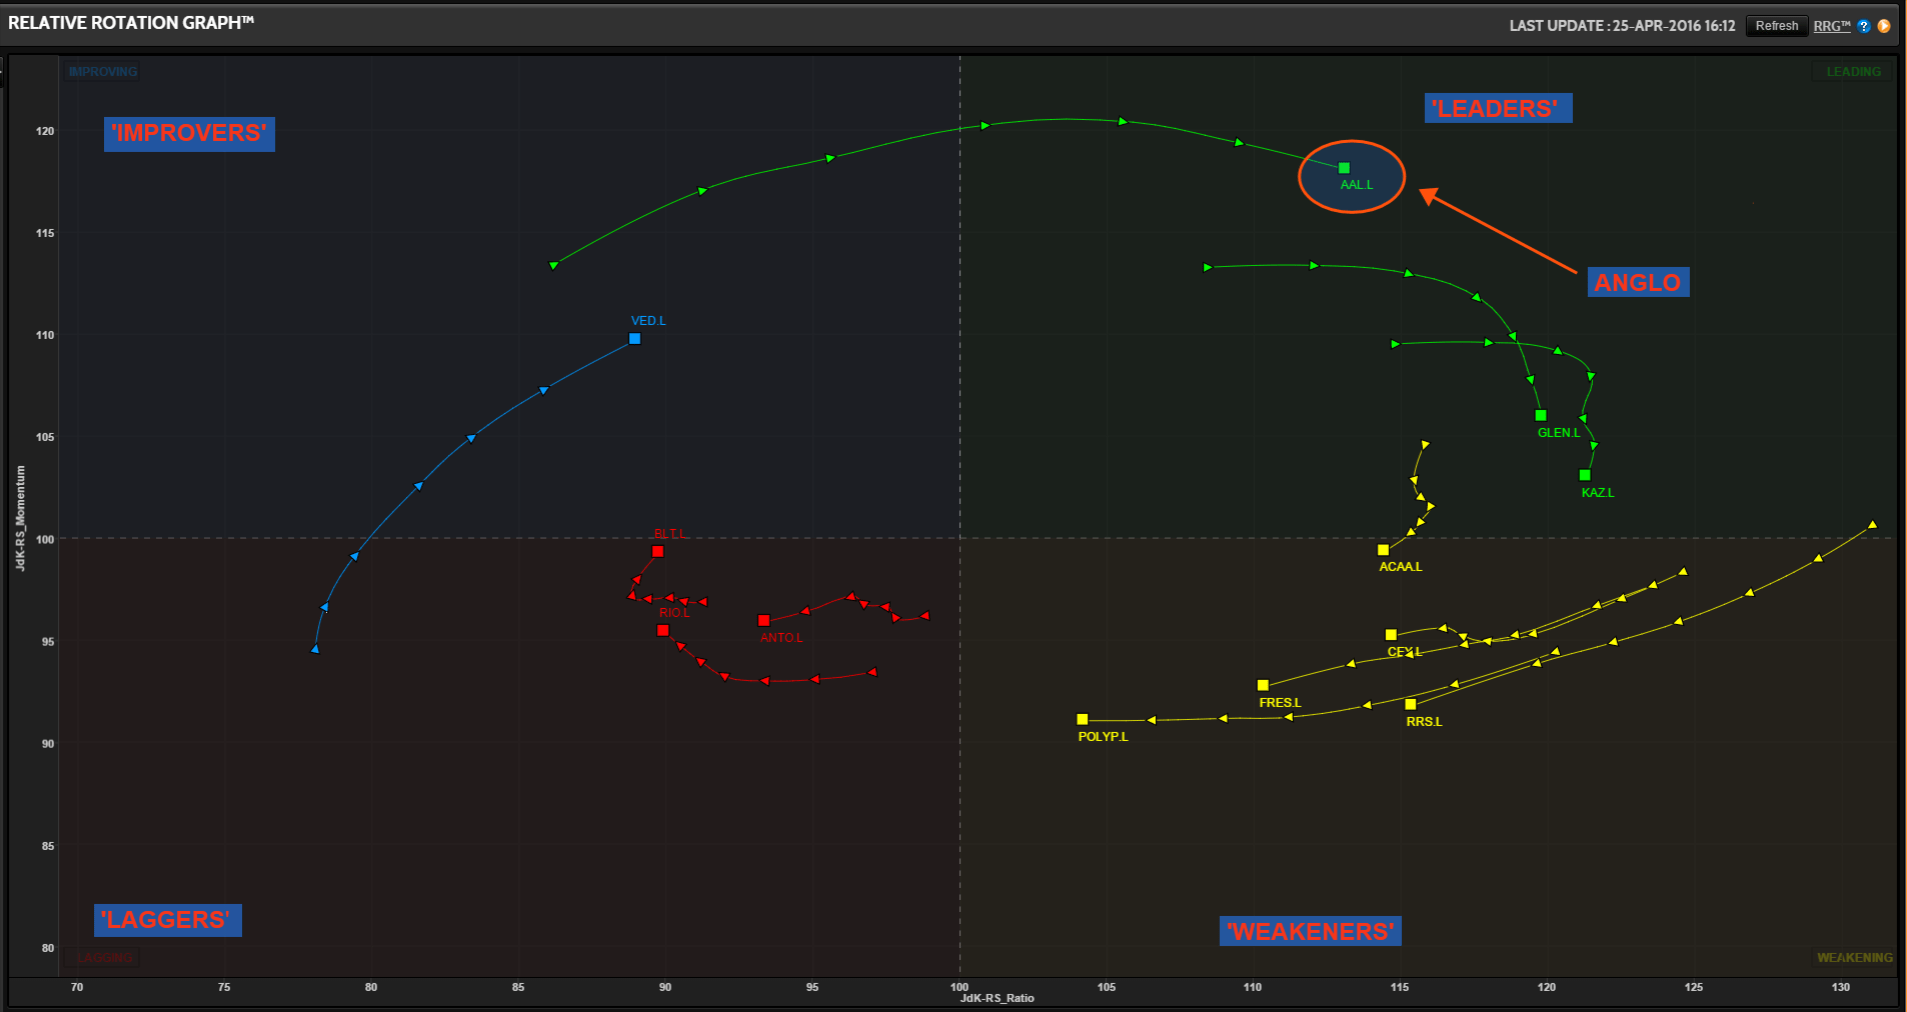
More importantly, such tools as Relative Rotation Graph (RRG) suggest the South Africa-focused group is likely to keep that cumulative leadership for further weeks.
There’s no need to fully grasp the exact workings of RRG (though you can find out more here).
Suffice to say that each triangle in our snapshot below denotes weekly performance of stocks relative to the sector (the mining index).
Outperformers are on the right, underperformers the left; those with strong momentum above the X axis, the weak below.
Please click image to enlarge
We can’t exclude the possibility that the entire sector could cool-off sharply, thereby making a mockery of the notion of relative winners/losers.
On balance though, a seismic global macro shock of the kind that rippled out from China last summer looks less likely for the medium term.
And even if it does occur, basis effects, in view of collapsed values all round will probably contain downside in core commodities prices to near August 2015 lows.
In the meantime, Anglo is starting its fourth week in the ‘leading’ quadrant after skimming off record lows at the start of the year.
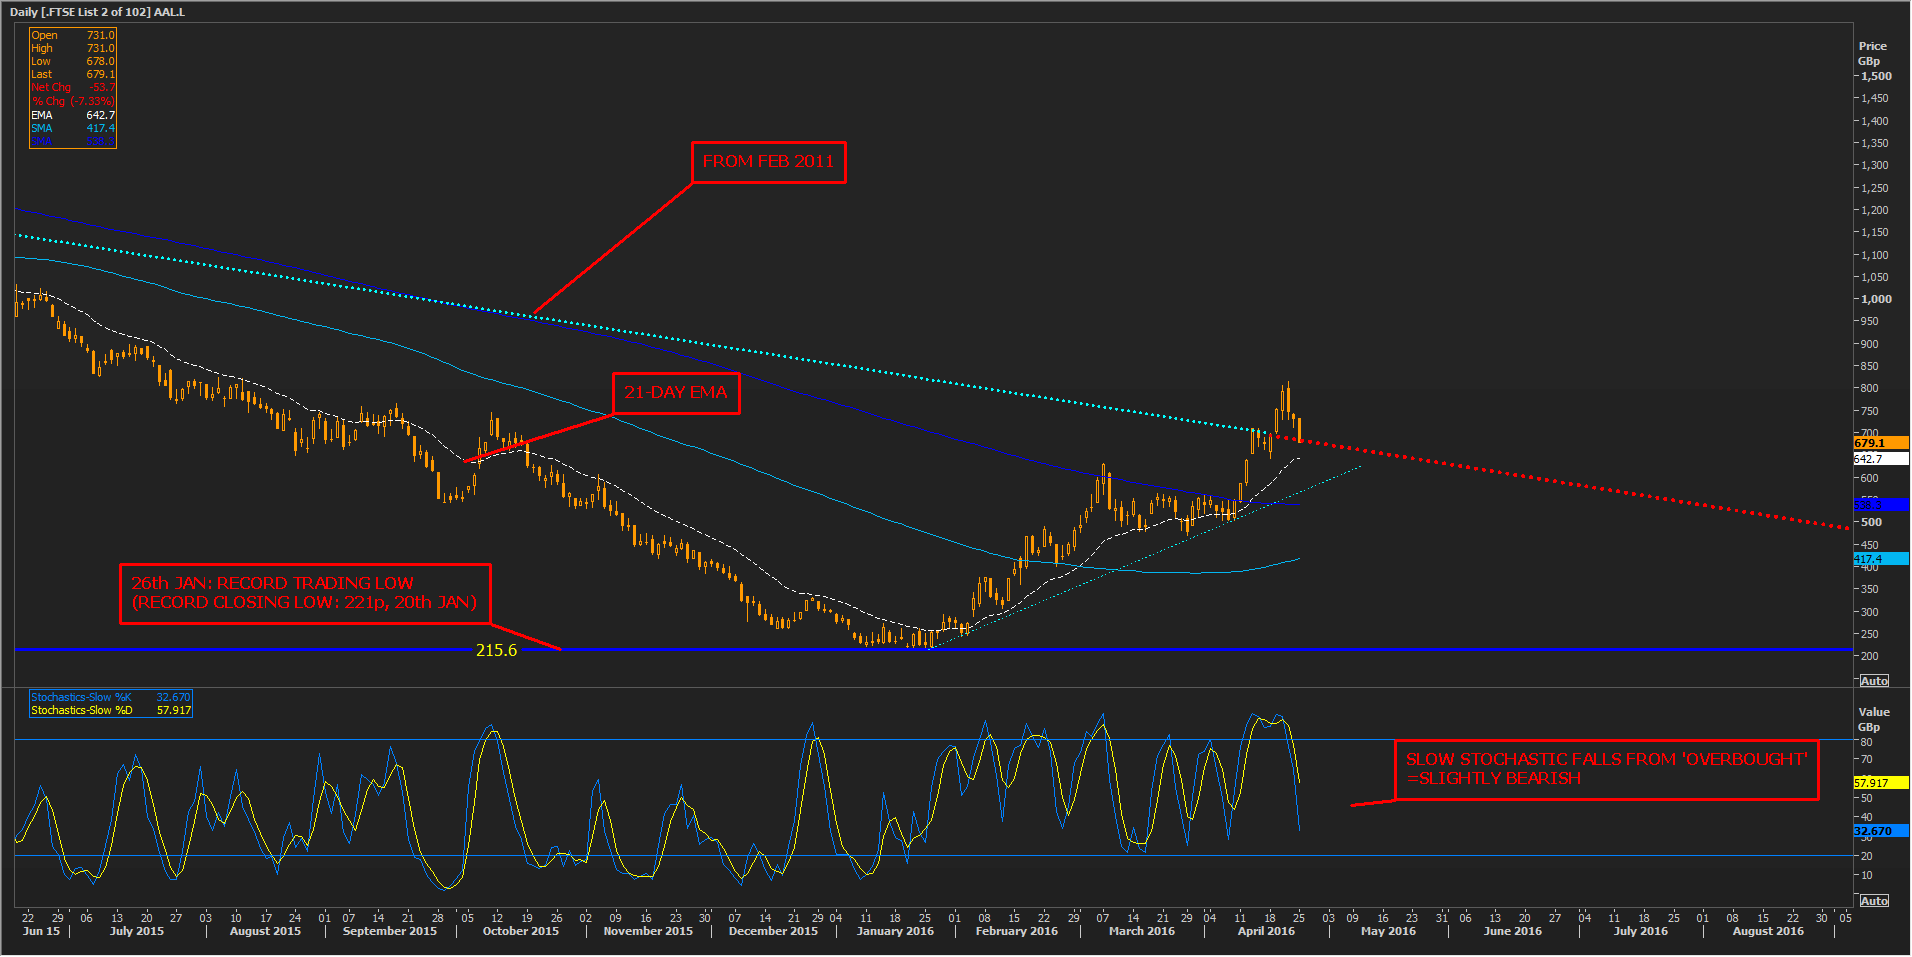
The classical technical chart below shows Anglo even managed to break above a descending trend in place since 2011, but that the miner is threatening to slip back below the trend.
For traders, the likelihood of sustainable backsliding is among the key watch points.
Despite a 7% drop on Monday, bulls may not begin to be overly concerned whilst Anglo trades above shorter-term moving averages (MA), e.g., the 21-day exponential MA represented in the chart below by a dotted white line.
Supportive phases tend to be accompanied by prices skimming above shorter-term MAs and that has been the case for Anglo since January.
Watch out for loss of such tone though: it will become visible before the linear version of the recent uptrend breaks, and probably well before longer-term MAs like the 200-day (dark blue) give way.
The Slow Stochastic momentum (‘sentiment’) sub-chart is now well below nominal overbought levels signified by values over ‘80’.
However, the steepness of its decline, and in turn that of the shares, suggests buyers may yet find better prices in the near term.
Please click image to enlarge
