


Amazon.com (AMZN)
click to enlarge charts
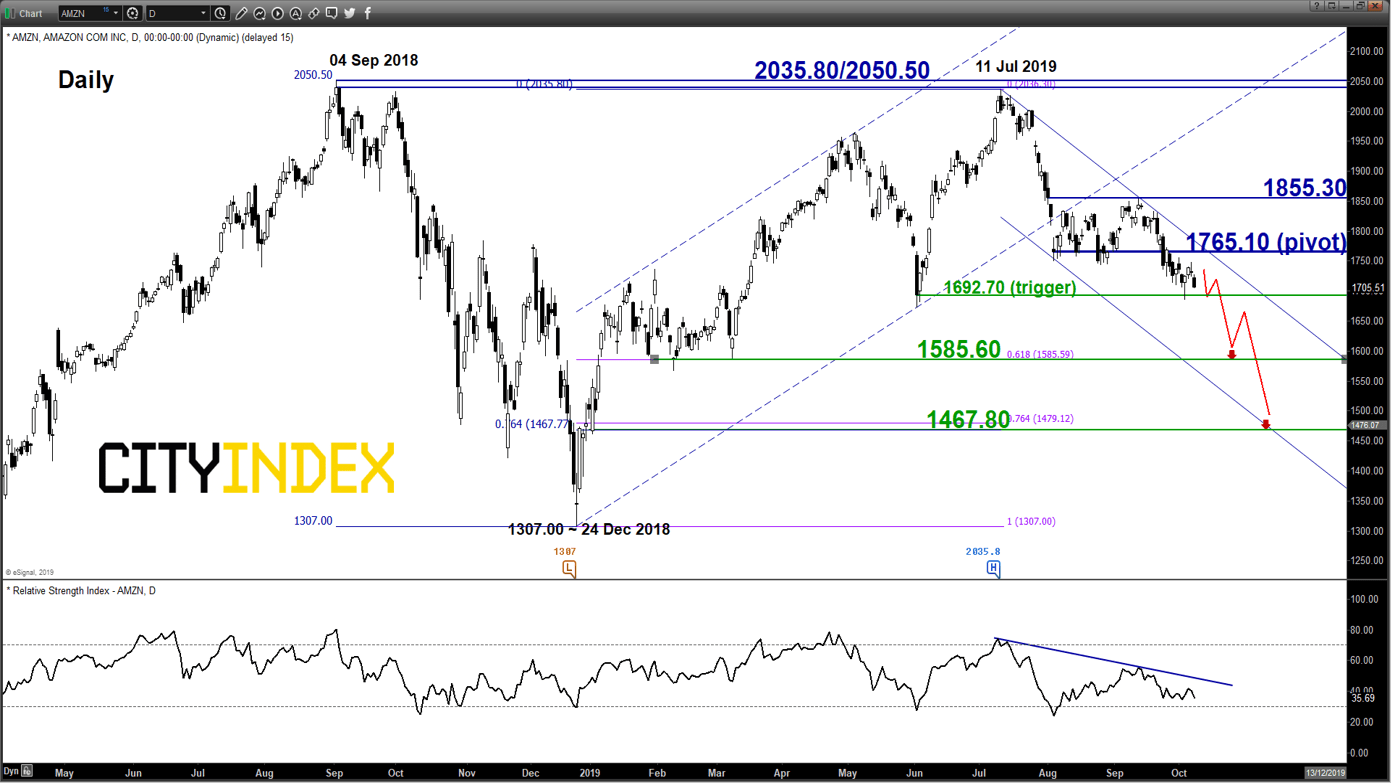
Key Levels (1 to 3 weeks)
Pivot (key resistance): 1765.10
Supports: 1692.70, 1585.60 & 1467.80
Next resistances: 1855.30 & 2035.80/2050.50
Directional Bias (1 to 3 weeks)
Amazon.com, a multinational technology giant that has business operations in e-commerce, cloud computing, digital streaming and artificial intelligence. Given its leadership in the U.S e-commerce industry, its share price movement can be used a gauge to dissect the health of the U.S. consumers as discretionary spending via e-commerce has taken over a significant portion of market share from traditional “brick & mortar” retailers.
Also, Amazon is a key component stock in the U.S. benchmark stock indices as it has the 3rd largest weightage in both the S&P 500 and Nasdaq 100.
Bearish bias below 1765.10 and a break below 1692.70 reinforces a further potential downleg to target the next medium-term supports at 1585.60 and 1467.80 next. On the other hand, a clearance with a daily close above 1765.10 negates the bearish tone for a push up towards to retest the 12 Sep 2019 swing high of 1855.30.
Key elements
- After a retest on its current all-time high level of 2050.50 on 11 Jul 2019, AMZN has declined by -17% and right now its price action is just 0.75% away from its 03 Jun 2019 swing low area of 1692.70; an important medium-term swing low as it has shaped a V-shaped reversal from it to retest its all-time high level printed in 04 Sep 2019.
- The recent rebound from 03 Oct 2019 low of 1685.06 is likely to be considered as corrective/dead cad bounce as its latest price action has gapped down and formed a daily bearish candlestick yesterday after a daily “Doji” candlestick formed on Mon, 07 Oct. These observations suggest sentiment has turned negative after a lack of bullish conviction to push prices higher.
- In addition, the daily RSI oscillator remains below a significant corresponding descending resistance at the 45 level and has not reached an extreme oversold level. These observations suggest that medium-term downside momentum of price action remains intact.
- The key medium-term resistance of 1765.10 is defined by the upper boundary of a descending channel in place since 11 Jul 2019 high and the former range support from 05 Aug/28 Aug 2019 low.
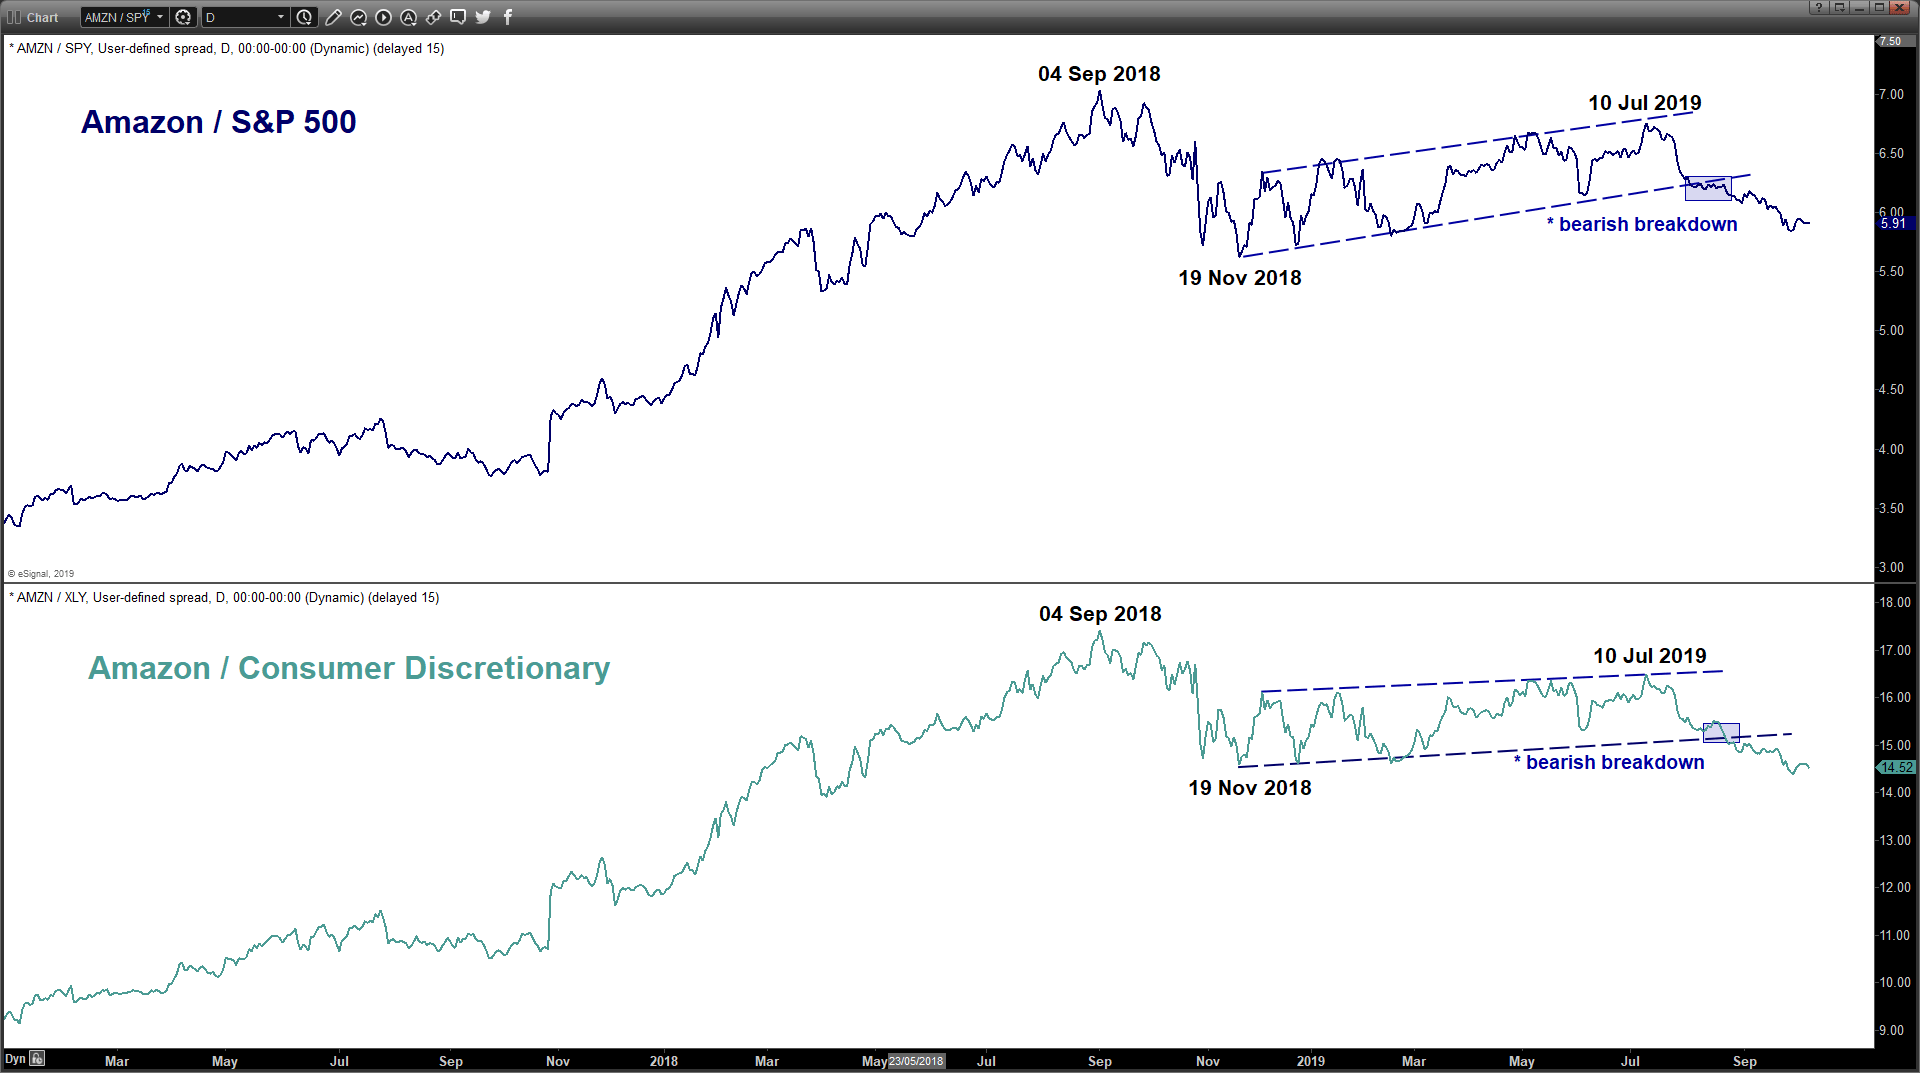
- Relative strength analysis against the market (S&P 500) and its sector (Consumer Discretionary) as seen from the respective ratio charts are suggesting further potential underperformance of AMZN.
Charts are from eSignal
Latest market news
Today 11:14 AM
Today 08:28 AM
Yesterday 03:30 PM
Yesterday 01:23 PM
Yesterday 11:00 AM
Latest Abe articles
October 24, 2023 09:00 AM
October 19, 2023 01:42 PM
October 11, 2023 02:28 PM
April 25, 2023 02:36 PM