


Amazon.com Inc (AMZN)

click to enlarge charts
Key Levels (1 to 3 weeks)
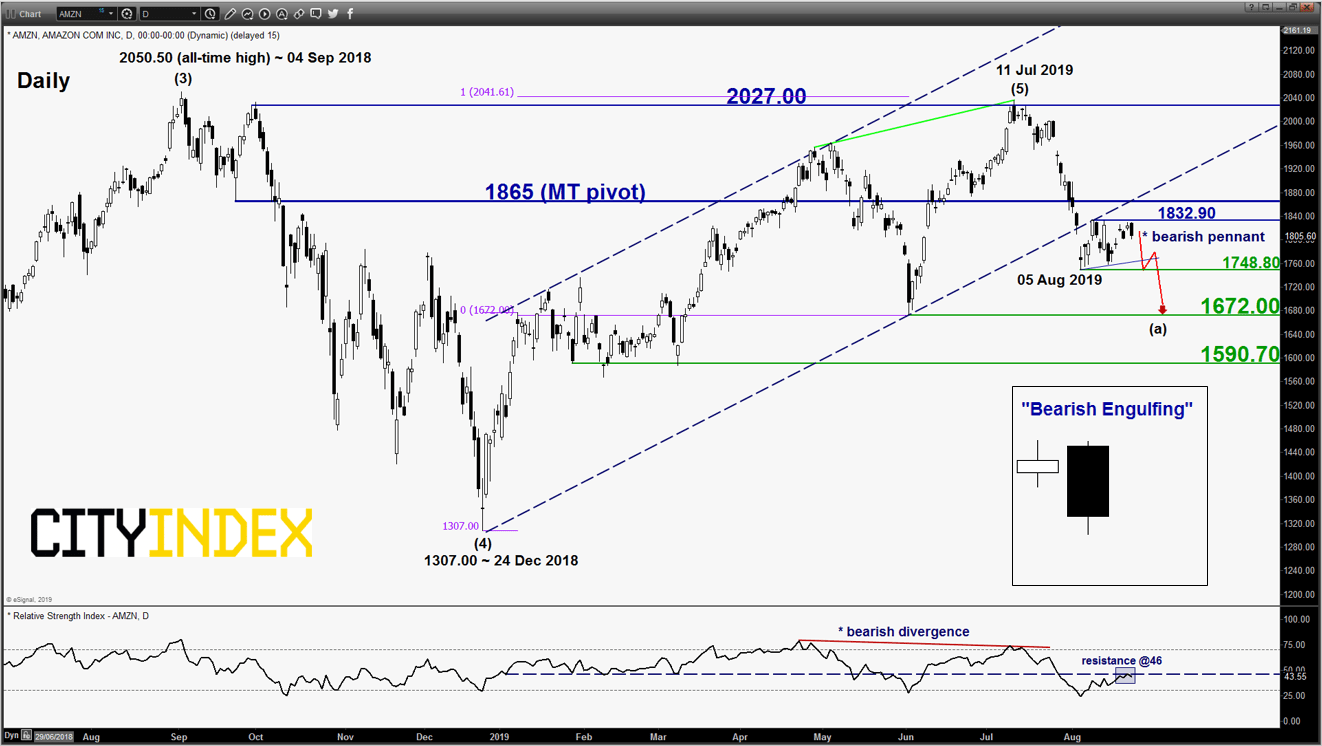
Intermediate resistance: 1832.90
Pivot (key resistance): 1865
Supports: 1748.80, 1672 & 1590.70
Next resistance: 2027.00
Directional Bias (1 to 3 weeks)
Bearish bias below 1865 key medium-term pivotal resistance for another potential downleg sequence to retest the 1748.80 near-term support (05 Aug 2019 low) before targeting the significant medium-term support at 1672.00.
On the other hand, a clearance with a daily close above 1865 invalidates the bearish scenario to kickstart for a squeeze up to retest the major range resistance at 2027
Key elements
- Since its 05 Aug 2019 low, AMZN has evolved into a “pennant range” configuration after its prior steep decline of 14.10% from 11 Jul 2019 high. The “pennant” configuration tends to be considered as a “breather consolidation” pattern before the direction of the prior move (down move seen in AMZN) resumes.
- Interestingly, the price action of AMZN has formed a daily “Bearish Engulfing” candlestick pattern at the end of yesterday, 22 Aug U.S. session right below the 1832.90 “pennant range” resistance after a 5-day bounce since 14 Aug. This type of candlestick pattern tends indicate a change in sentiment from positive to negative and is often seen at a swing high that led to a potential bearish reversal in price action.
- Relative strength analysis against the market (S&P 500) and its sector (Consumer Discretionary) are suggesting further potential underperformance of AMZN.
- The significant medium-term support of 1672 is defined by the 03 Jun 2019 swing low and a Fibonacci retracement/expansion cluster.
Charts are from eSignal
Latest market news
Yesterday 11:09 PM
Yesterday 11:01 PM
Yesterday 04:00 PM
Yesterday 01:15 PM
Yesterday 11:30 AM
Latest Abe articles
October 24, 2023 09:00 AM
October 19, 2023 01:42 PM
October 11, 2023 02:28 PM
April 25, 2023 02:36 PM