


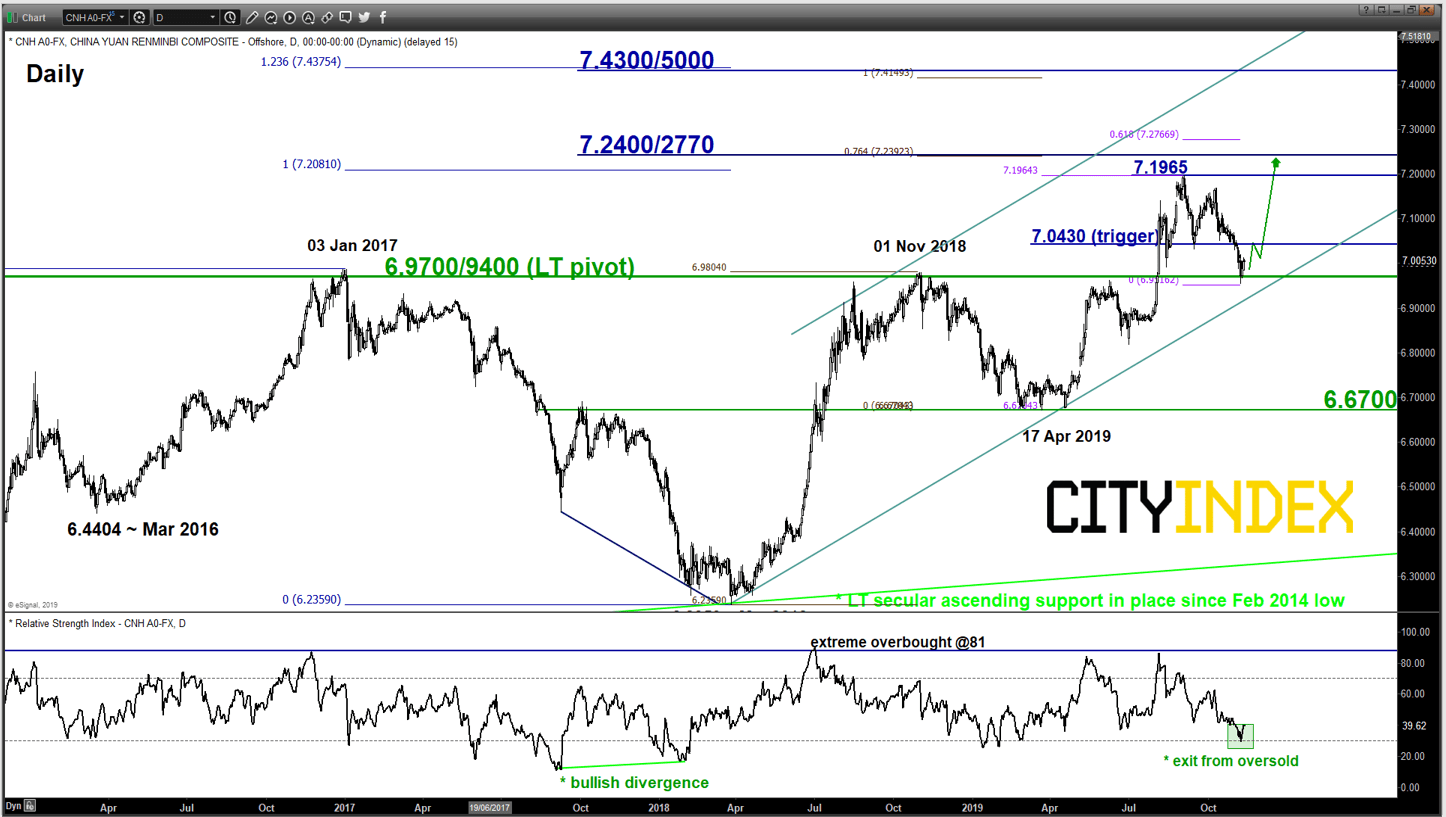
USD/CNH – 2-month decline stalled at key LT pivotal support
click to enlarge chart
- The 2600+ pips slide from its 02 Sep 2019 swing high of 7.1964 has managed to stall right at the long-term pivotal support zone of 6.9700/9400 as per defined by the former major range resistance from Jan 2017 to Nov 2018, close to the lower boundary of a major ascending channel support in place since Mar 2018 low and a Fibonacci retracement cluster.
- The daily RSI oscillator has just exited from its oversold region which suggests the recent decline in price action from 02 Sep 2019 high is overextended and increases the odds of a bullish reversal.
- Right now, a break with a daily close above 7.0430 is likely to a potential fresh impulsive upleg sequence to retest 7.1965 before targeting the next resistance zone of 7.2400/27700.
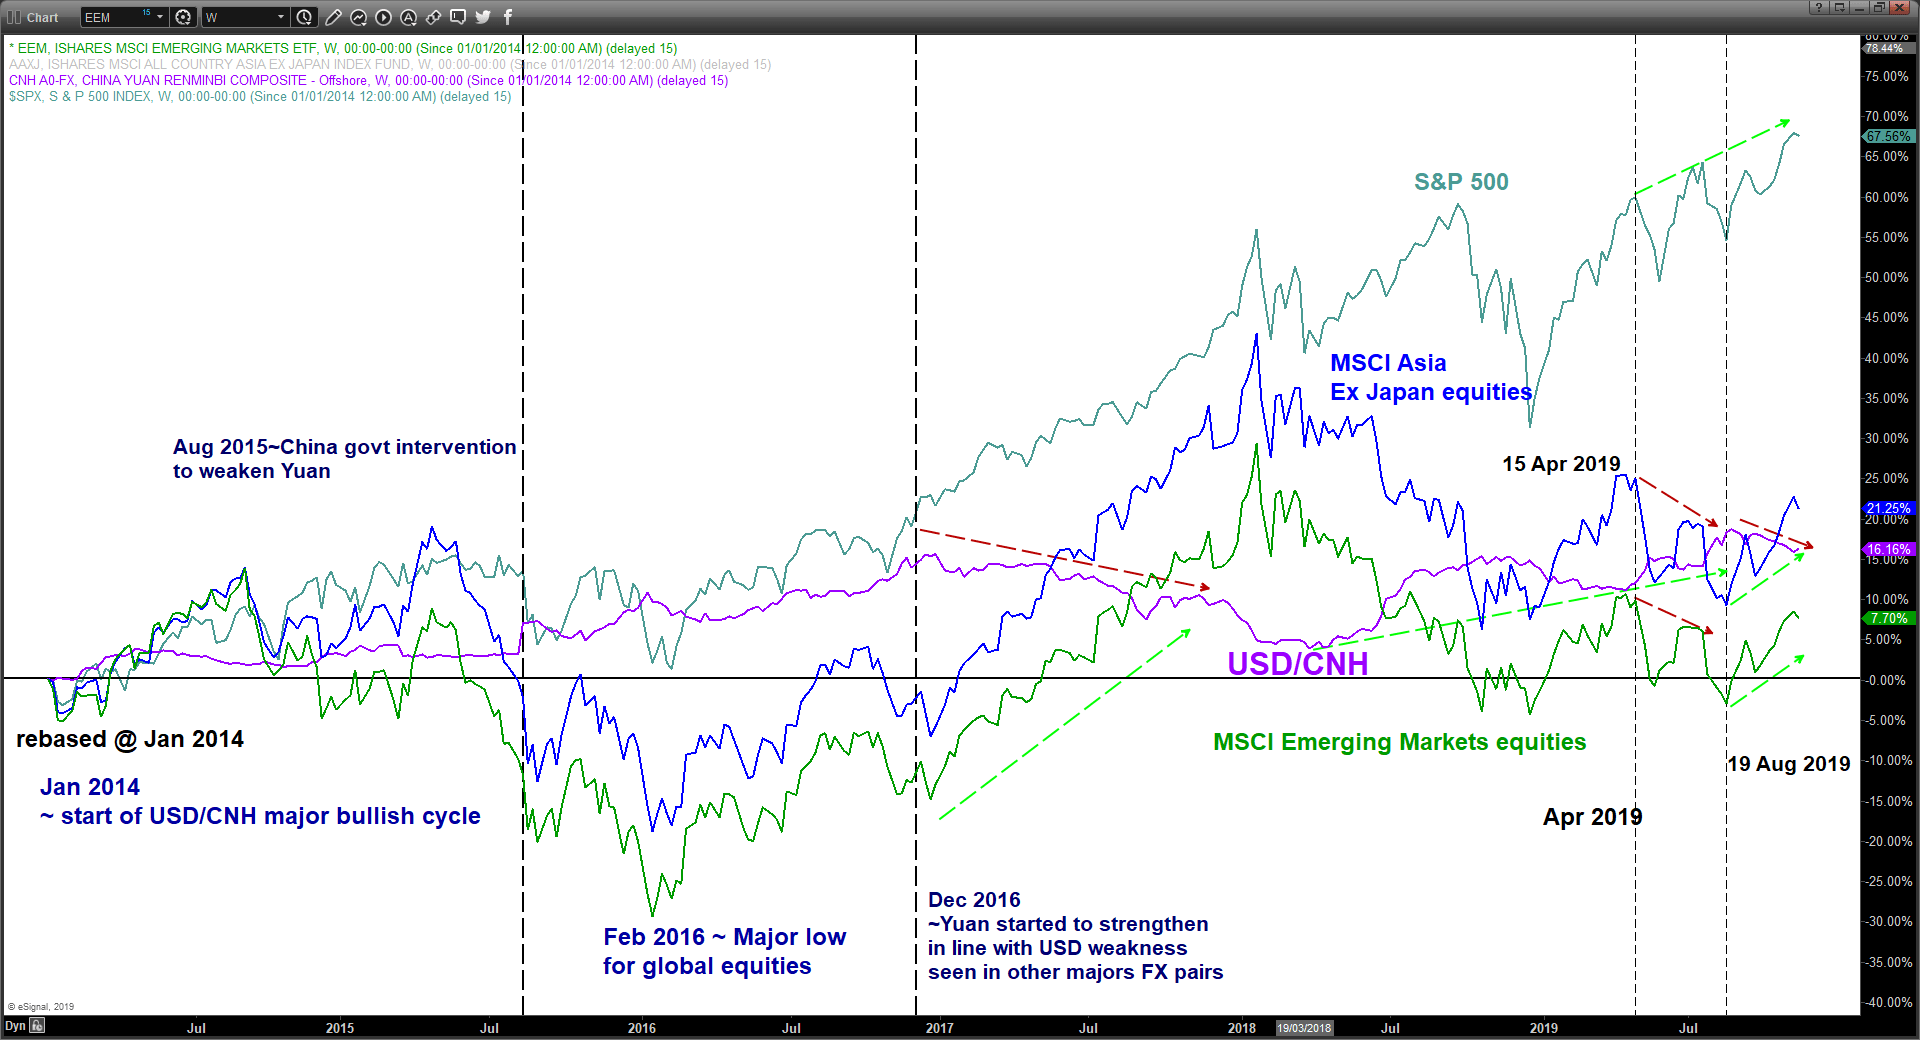
Relationship between USD/CNH, Emerging Markets, Asia Ex Japan equities & S&P 500
click to enlarge charts
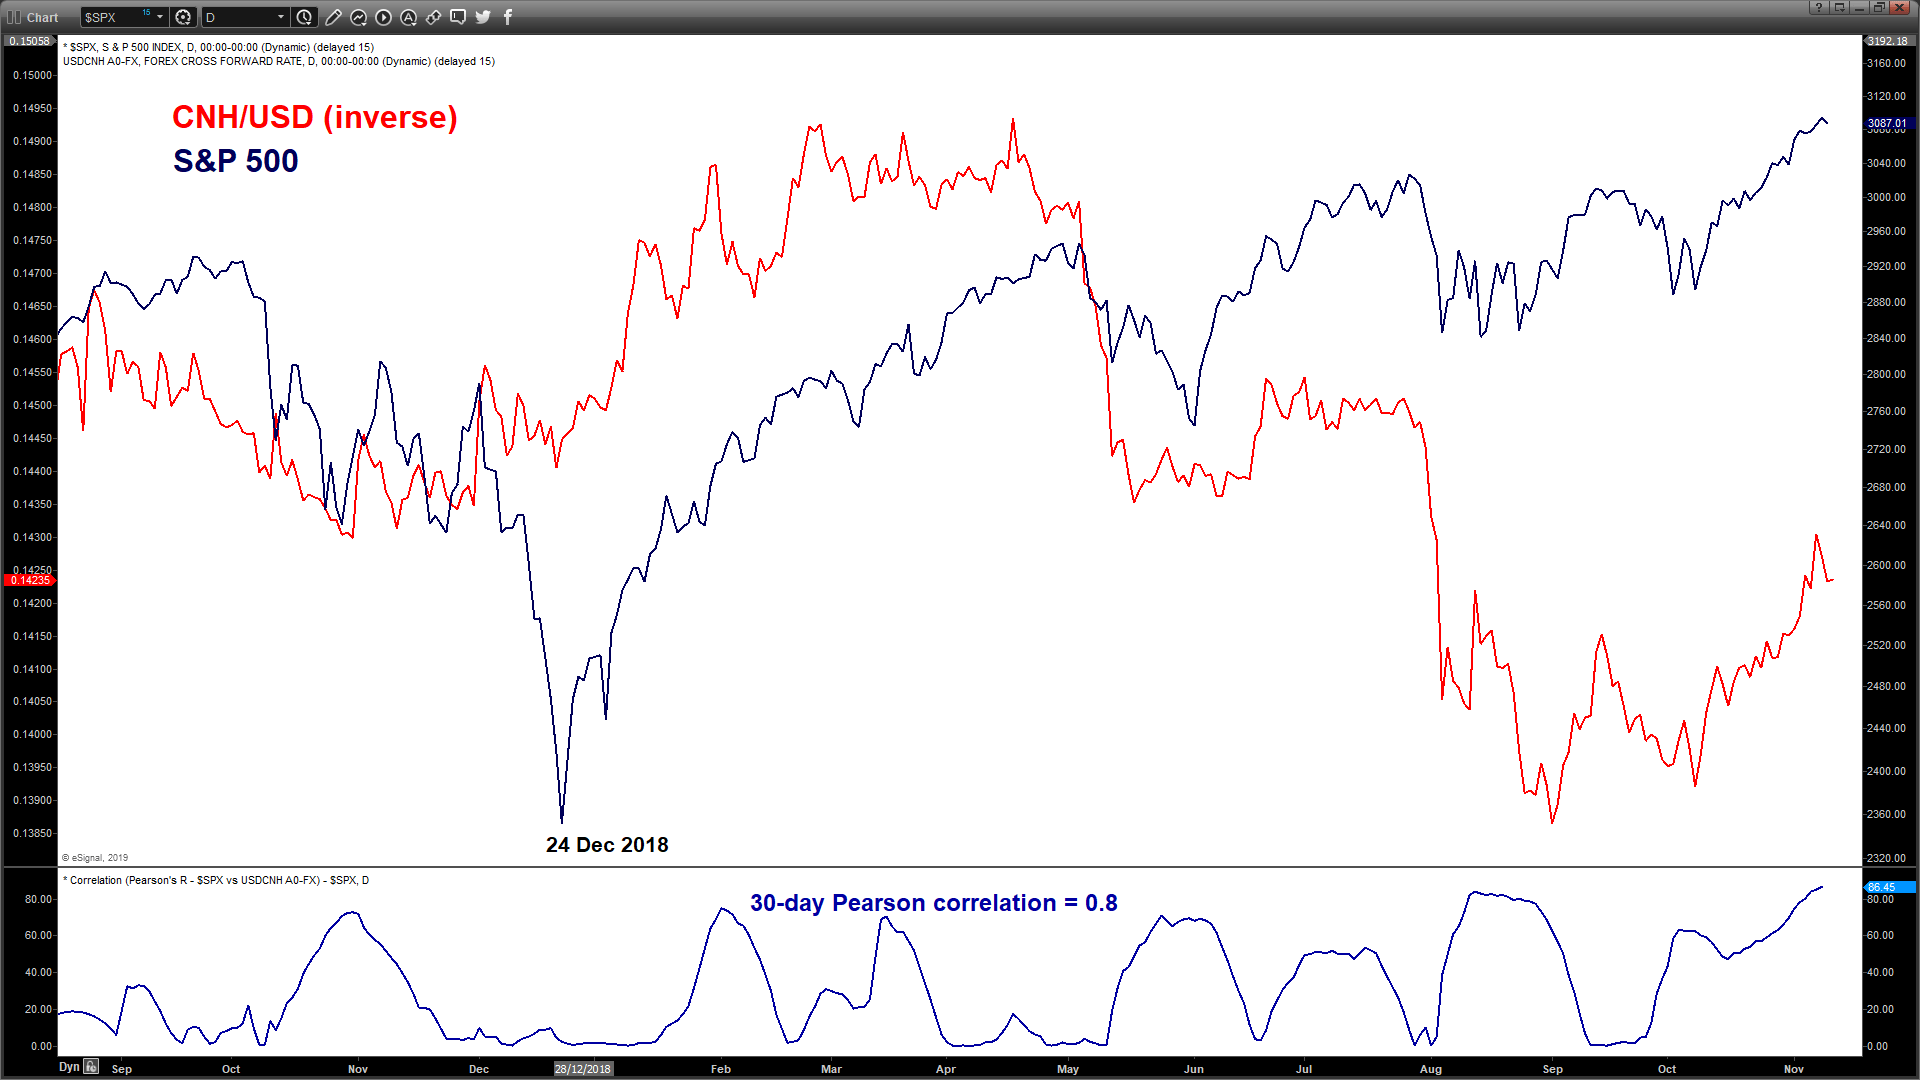
- As seen from the first chart, the recent slide seen in the USD/CNH from its medium-term swing high area of Aug/Sep 2019 has been positive for Emerging Markets, Asia Ex Japan equities and even the S&P 500.
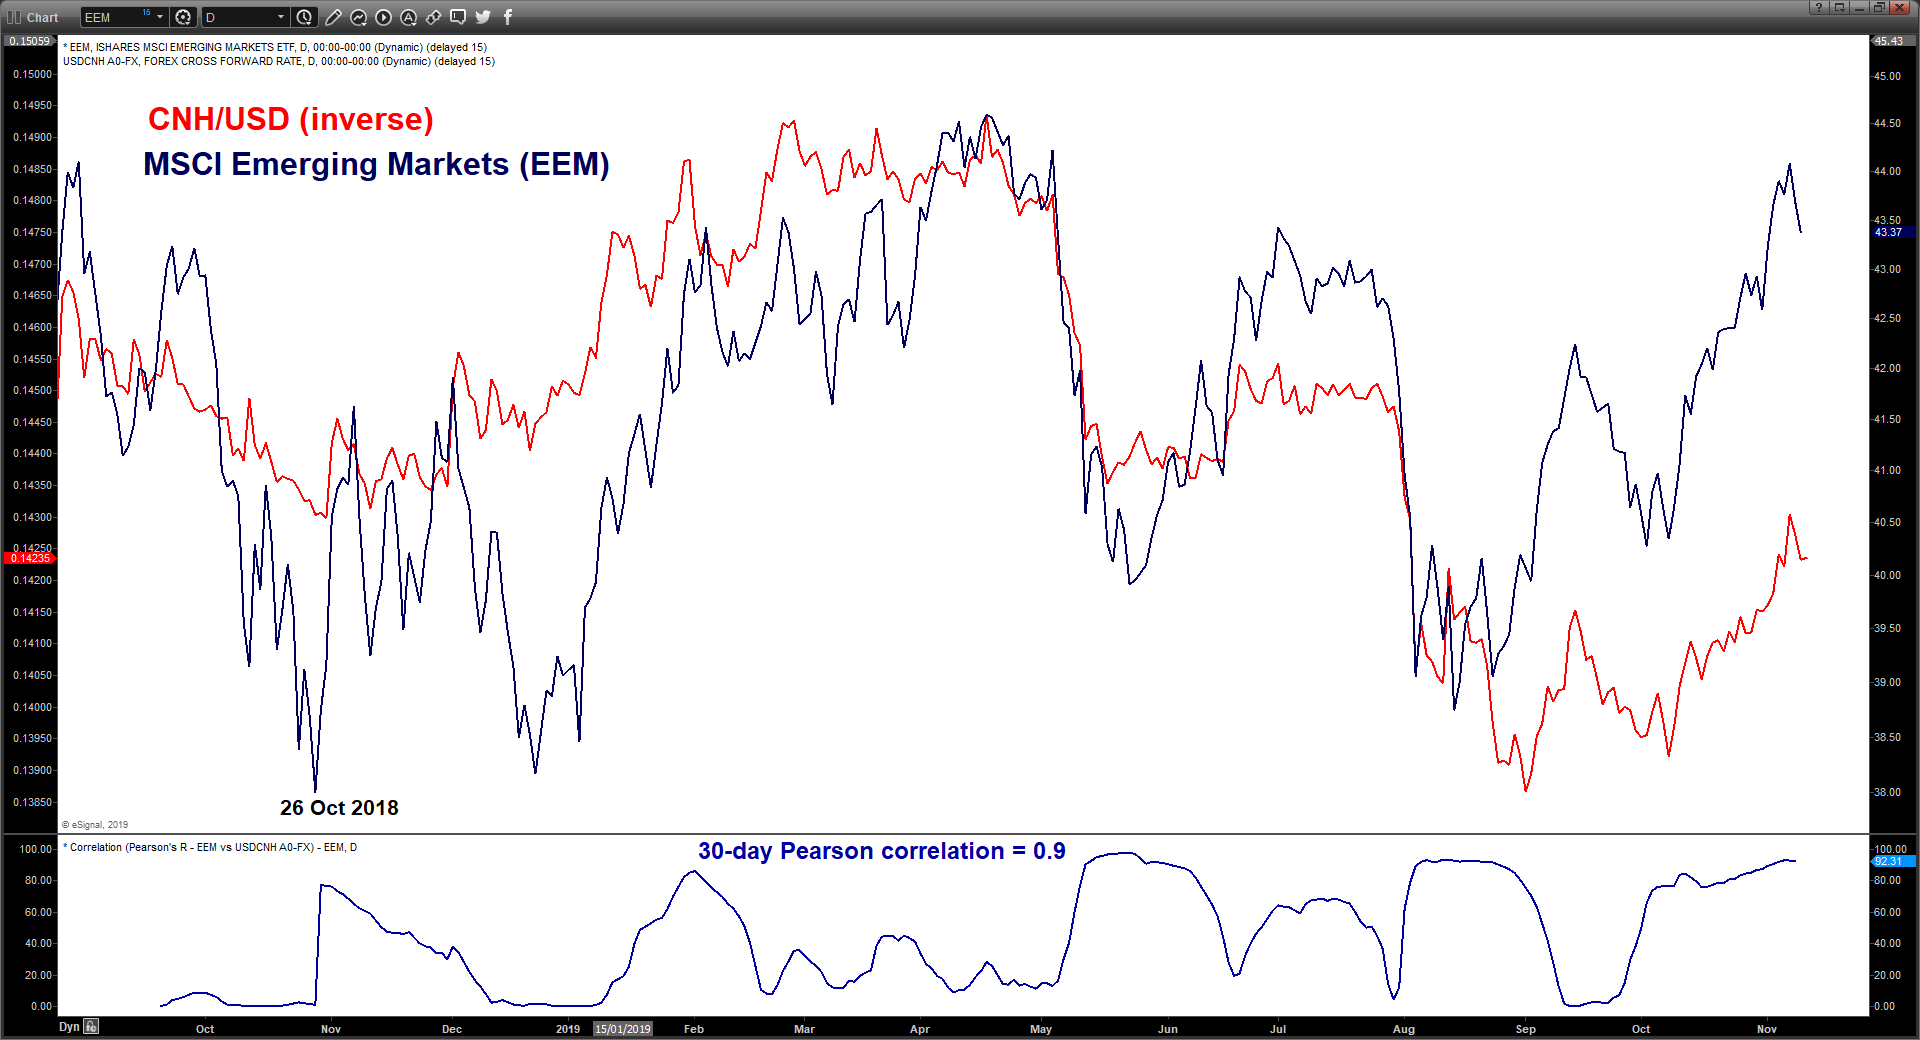
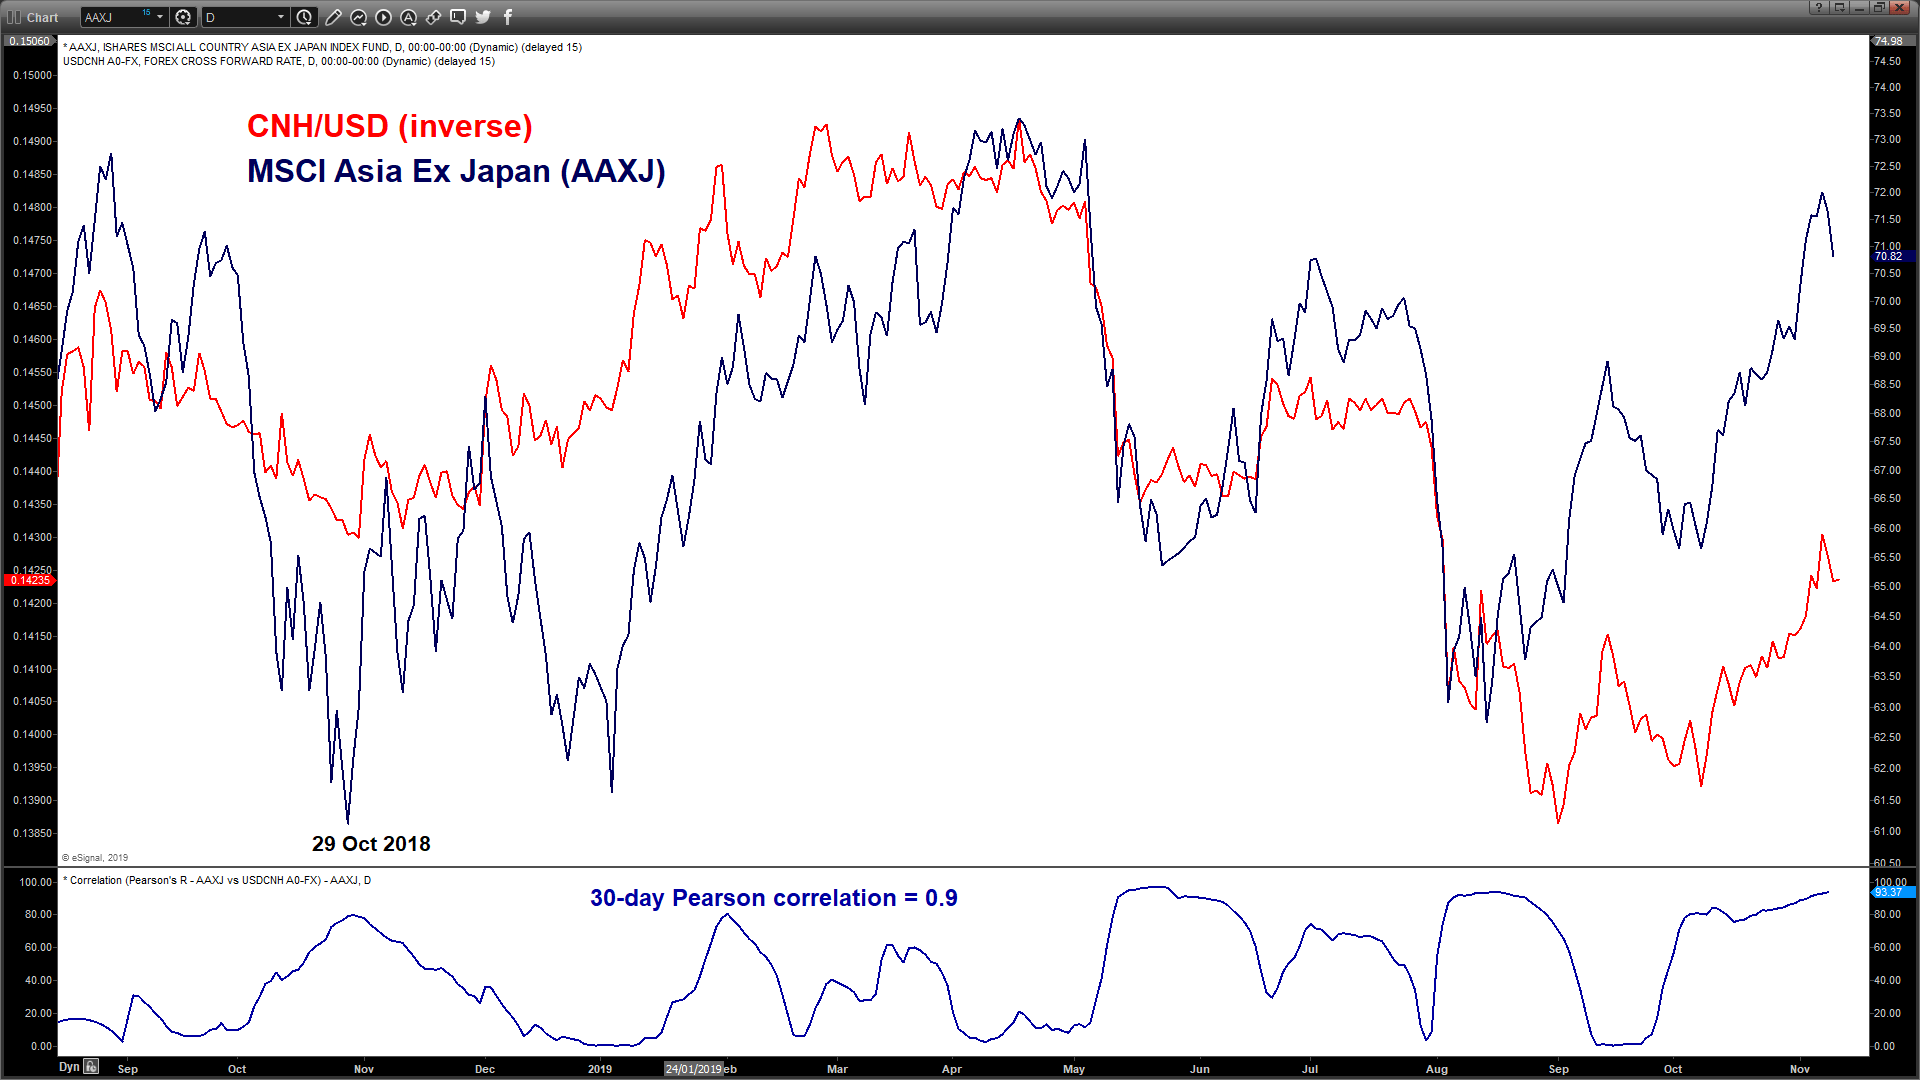
- By looking at the Pearson correlation statistical analysis on the movement of the USD/CNH against Emerging Markets ETF (EEM), Asia Ex Japan ETF (AAXJ) and the S&P 500, the inverse of the USD/CNH (by converting CNH as the base currency) has strong direct correlation with the EEM, AAXJ and S&P 500. A Pearson correlation coefficient that is closer to +1 indicates a stronger positive linear correlation which means a stronger CNH against the USD tends to see a similar upward movement in the EEM, AAXJ and S&P 500.
- In a nutshell from a statistical standpoint, if the USD/CNH is able to see a bullish reversal right at the 6.9700/9400 key long-term pivotal support, it can trigger a potential downside movement in the EEM, AAXK and the S&P 500.
Medium-term technical outlook on Emerging Markets ETF (EEM)
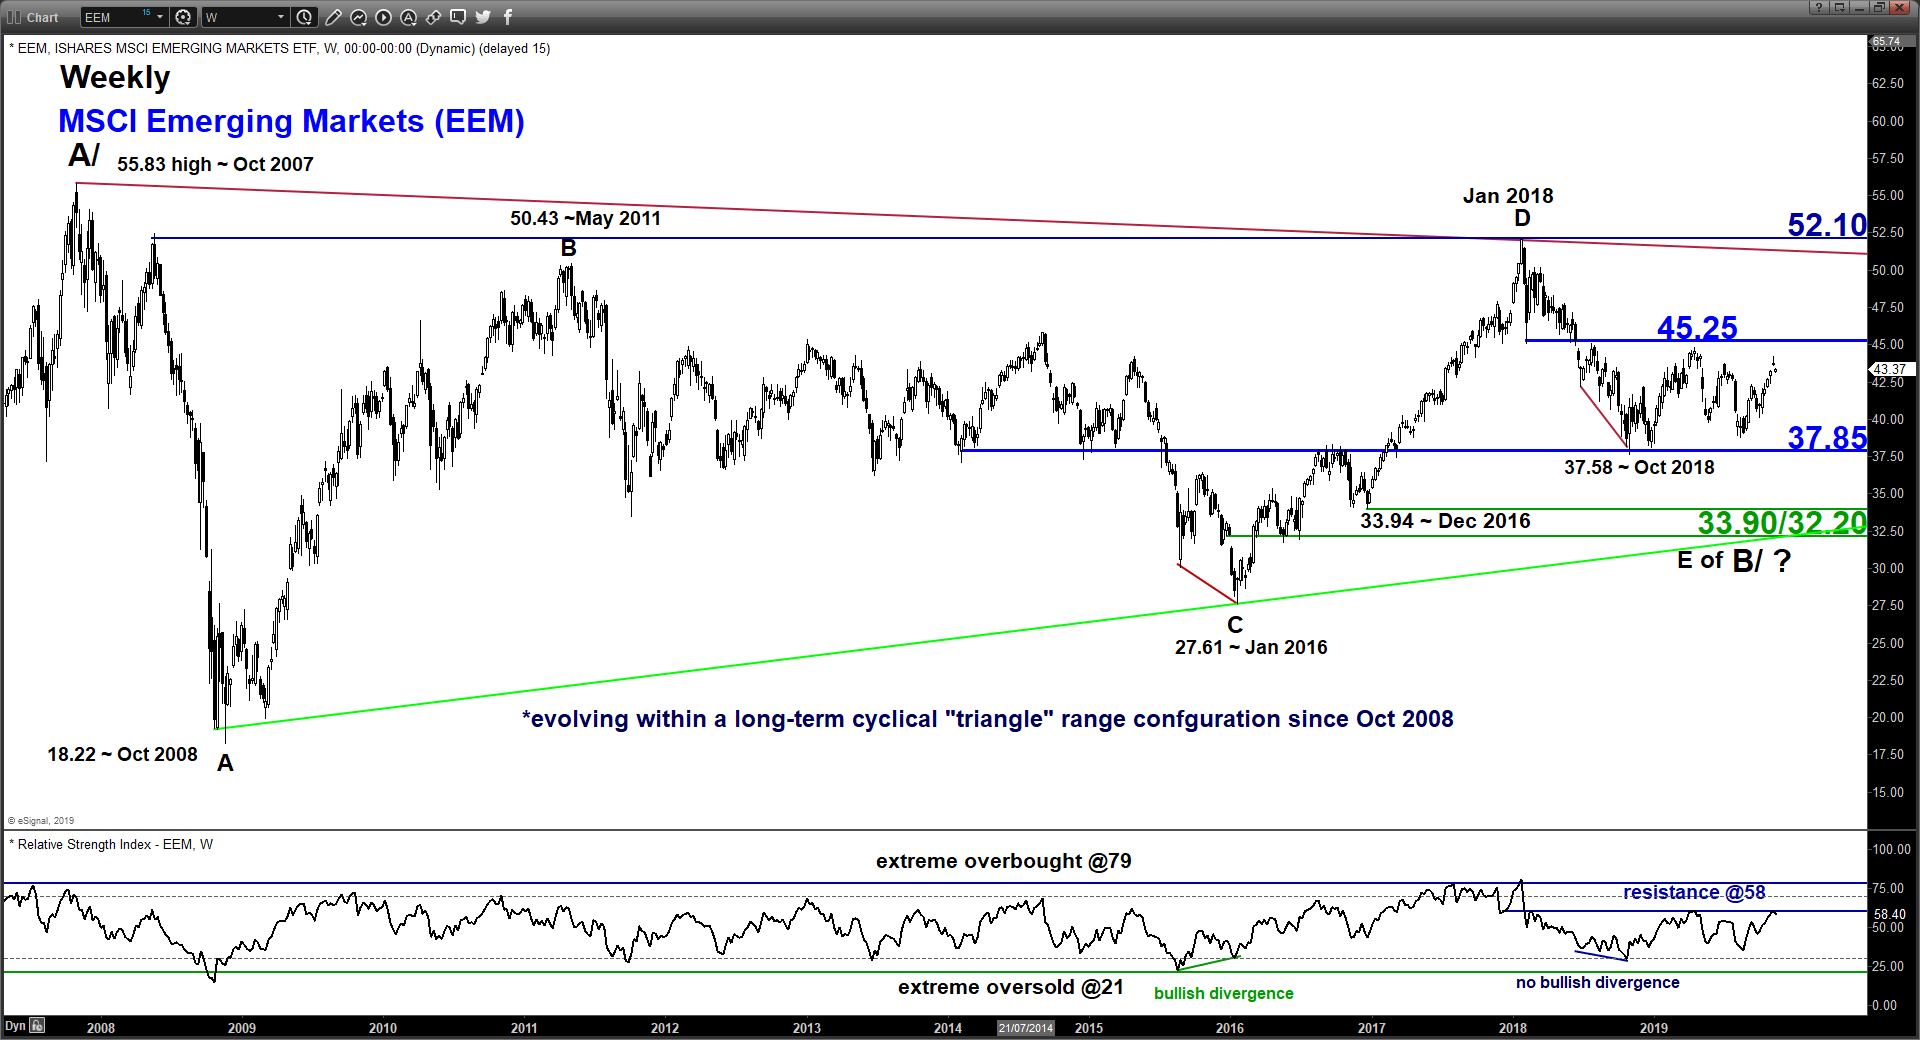
click to enlarge charts
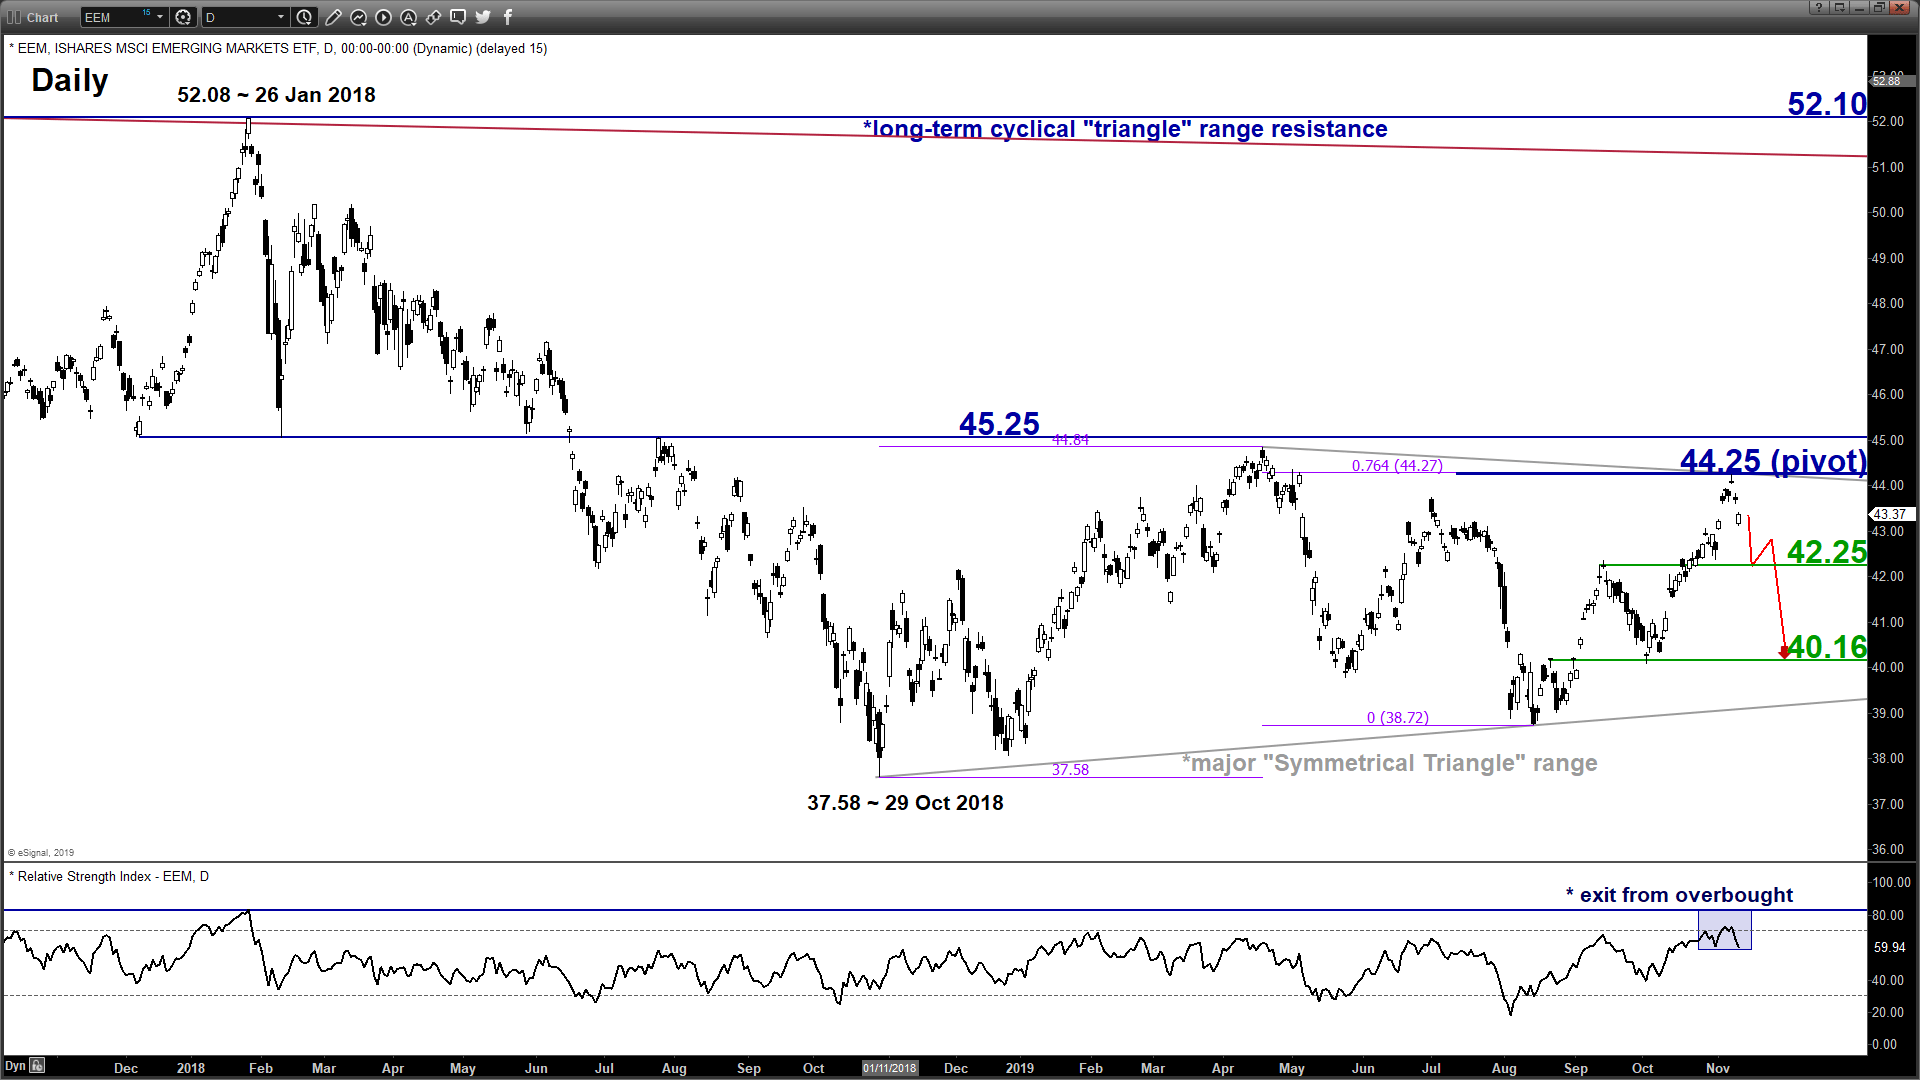
Key Levels (1 to 3 weeks)
Pivot (key resistance): 44.25
Supports: 42.25 & 40.16
Next resistance: 45.25
Directional Bias (1 to 3 weeks)
Bearish bias below 44.25 pivotal resistance for a further potential push down within a major “Symmetrical Triangle” range configuration to target 42.25 and 40.16 next.
However, a clearance above 44.25 negates the bearish tone for a push up to challenge the 45.25 upper limit/resistance of the long-term neutrality range.
Key elements
- Recent price action has staged a retreat from the upper limit/resistance of the “Symmetrical Triangle” range configuration in place since 29 Oct 2018 low and it has also formed a daily bearish “Gravestone Doji” candlestick pattern on last Thurs, 07 Nov after a test on the “Symmetrical Triangle” range resistance. These observations increase the odds of a medium-term bearish reversal in price action.
- The daily RSI oscillator has just exited from its overbought region.
- The “Symmetrical Triangle” range resistance of 44.25 also confluences with the 0.76 Fibonacci expansion of the recent up move from 29 Oct low to 17 Apr 2019 high projected from 14 Aug 2019 low which suggested a potential exhaustion/terminal point for the recent 3-month up move from 14 Aug 2019.
Charts are from eSignal
Latest market news
Yesterday 11:09 PM
Yesterday 11:01 PM
Yesterday 04:00 PM
Yesterday 01:15 PM
Yesterday 11:30 AM
Latest Indices articles
April 18, 2024 04:46 PM
April 17, 2024 11:00 AM
April 16, 2024 08:00 PM
April 16, 2024 04:54 PM