A bird out of hand is Twitter really worth just 5 50 a share
Key points: Twitter releases earnings Tuesday night. Wall Street expects a decent $0.04 per share, up from $0.02 per share in Q1. However, if […]
Key points: Twitter releases earnings Tuesday night. Wall Street expects a decent $0.04 per share, up from $0.02 per share in Q1. However, if […]
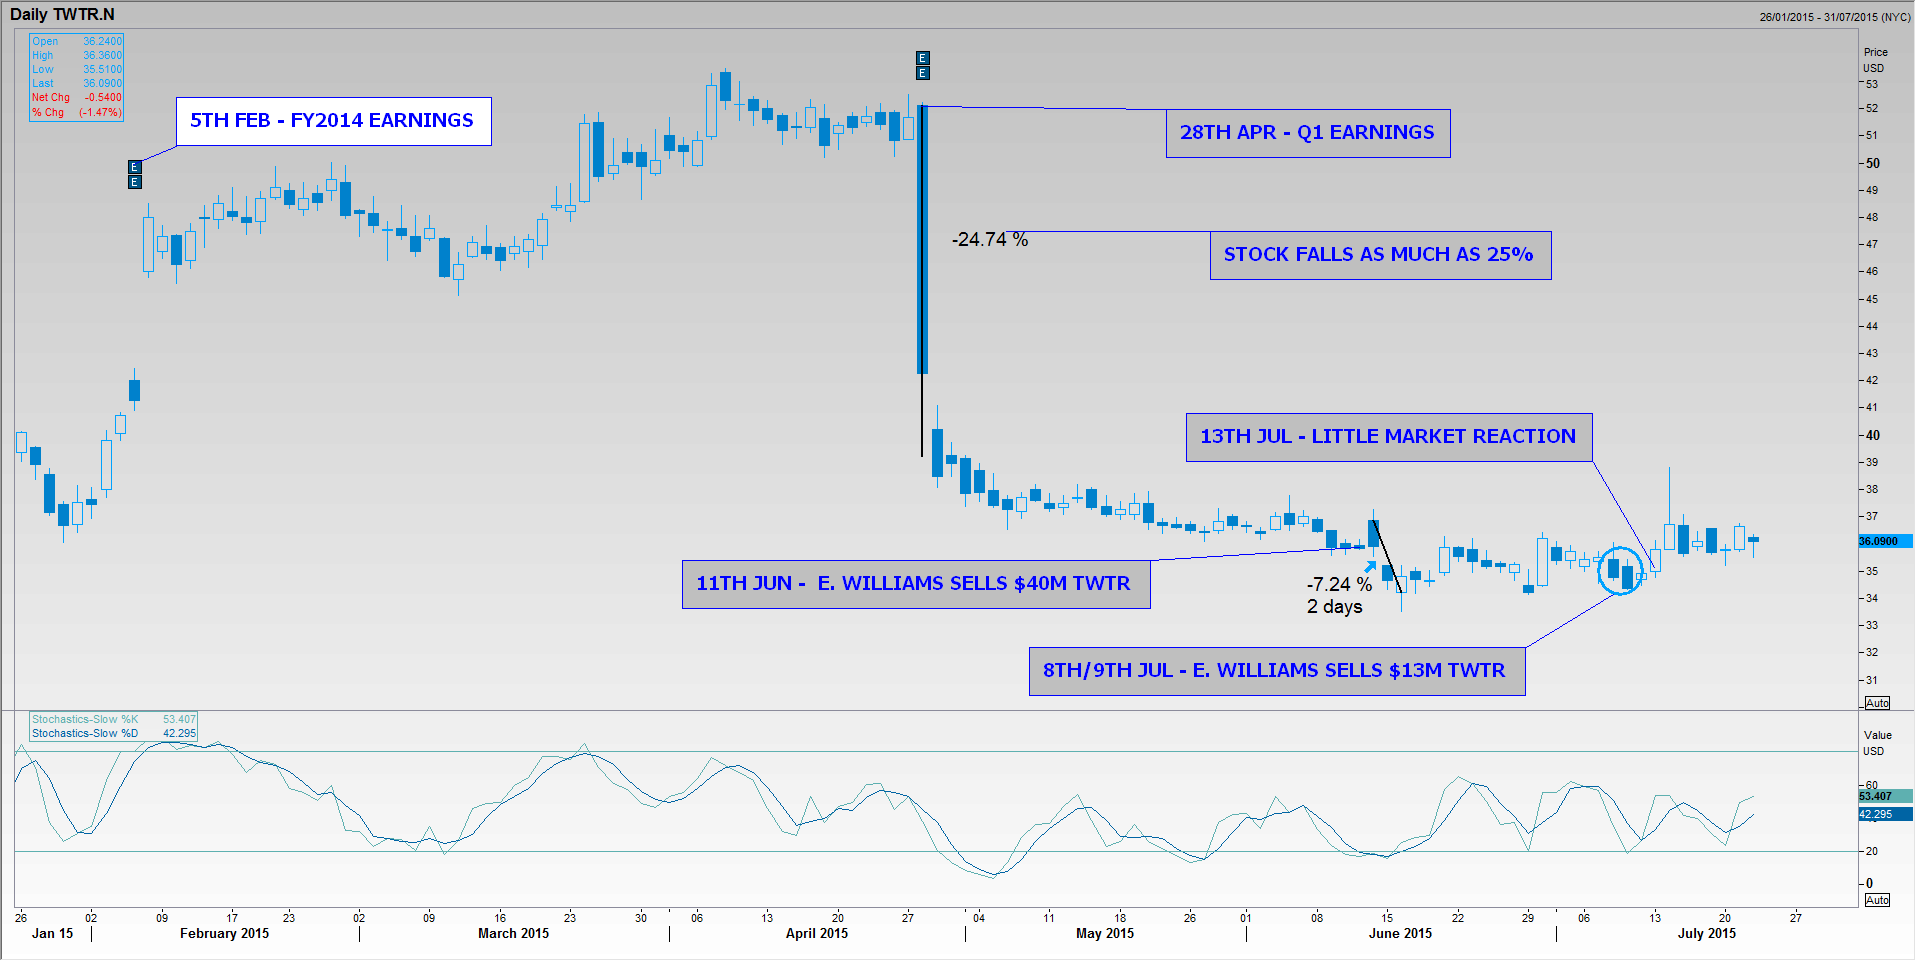
Between 8th and 9th July, Twitter board member Evan Williams sold about $13m worth of shares in the company he co-founded in 2006-2007.
On 11th July, the sales were disclosed in a filing, as required by US securities regulations for director share transactions (under the SEC’s ‘Form 4’ rule).
Placed in context – there was little news value in the event – Evans had in fact sold much more of his shares, $40.5m, in TWTR, about a month before.
Twitter shareholders – many of whom were still in the equivalent of investor ‘shock’ from a rout of as much as 25% on the date of its first-quarter earnings late in April – seemed unperturbed.
After all, owners and founders of high-profile companies buy and sell stock frequently – often in sizeable trades – without necessarily implying any change of attitude towards their firms.
The same in all probability applies to Williams’ disposals.
He has been among the most loyal of insiders.
He only started reducing his TWTR holdings at the end of November 2014, about four years after resigning as CEO.
And, as this article was close to publication, his remaining 7.79% was still the largest Twitter holding owned by an individual.
Nevertheless, normal equity market behaviour patterns suggest that stock sales by insiders, especially those as prominent as Williams, almost invariably lead to a knee-jerk reaction in the share price, once disclosed.
Usually the reaction will be that the shares fall further than the level brought about by the block trade itself.
The effect often evens itself out within days, but it’s usually at least visible.
If the price reaction is ambiguous, investors should be on the lookout for something unusual.
Twitter’s shares did fall after Williams sold in June, losing about 7% over two sessions, before recouping in subsequent days.
But after Williams’ July transactions were revealed, the shares rose.
Please click image to enlarge
M&A talk that broke out in late June was only the most recent of several persistent bouts that have surrounded Twitter shares since the stock listed a little under two years ago.
These have sprung up with such frequency they have almost ceased to be remarkable.
Amid a price that rocketed as high as $73 within weeks of TWTR’s November 2013 flotation at $45, before it fell to as low as $30 in May, the company has been more prone to hope and rumour than its rivals Facebook and LinkedIn.
Takeover talk intensified after Twitter’s poor first-quarter results in April, with revenue weaker than expected, a widened net loss and a more pessimistic sales forecast for the year than the one given before.
Twitter also lost its high-profile CEO, Dick Costolo, weeks later and several other senior managers and executives joined him soon afterwards.
In fact, the rate of exits was even higher than Twitter Inc’s already busier-than-average turnover of top talent.
This served to underline the sense of turmoil at the company even further.
The situation hasn’t been helped by the persistent mismatch between Twitter’s forecasts and its actual results.
Most recently, Twitter retreated from earlier estimates that it would book revenues of as much as $2.35bn in 2015.
It said in its first quarter report that its annual tally was likelier to be as low as $2.17bn.
At the same time, the market had previously been even more bullish than the company.
Consensus forecasts showed analysts were expecting 2015 revenues of $2.37bn before Twitter downgraded forecasts.
In short, investors’ continuing difficulties in forecasting the financial performance of Internet firms are well represented by Twitter.
It’s a challenge investors have faced from dot com boom to bust, and is the biggest factor obscuring valuation.
The issue has forced investors to seek ever more unconventional yardsticks against which to measure fast-growing but often abstruse Internet firms.
Subscriber growth, often cast by social media companies as ‘Monthly Active User’ (MAU) figures, is probably the least controversial metric they have favoured.
That Twitter’s MAUs actually rose in Q1 but the company still lost about $7bn in market value in one session speaks to the hunger that investors continue to have for less equivocal, perhaps more traditional valuation tools.
But unfortunately, conventional measures of earnings and consequent valuation, embodied by US Generally Agreed Accounting Principles (GAAP), can only take investors so far.
GAAP principles inevitably underline the obvious fact that Twitter has posted net losses in each year of its existence and is expected to continue to do so for years to come.
A resolution of the dilemma needs tools that are ‘open’ enough to capture the essential ‘in-transition’ nature of online consumer-orientated firms whilst at the same time stringent enough to satisfy statutory standards. (Not to mention common sense).
Analysts have sought out such valuation models as ‘discounted cash flow’ (DCF) to reconcile poor current earnings power versus potential future growth.
The DCF model lends itself to companies like Twitter because, as its name suggests, it places the biggest emphasis on cash flows rather than revenues or profits.
Paradoxically, this in some ways makes it an even tougher judge of worth than profitability because ‘free cash flow’ is more difficult to game.
The ‘discounted cash flow’ (DCF) refinement takes the ‘ending balance’ principle further and uses forecasts for forthcoming cash flows, ‘discounted’ by capital costs to determine how attractive an asset is.
If cash flows turn out to be worth more at the end of a given period than current costs, then there’s a good chance the asset is worth investing in.
The model can also tell us what financial medicine a company needs in order to reach a satisfactory level of profitability and growth.
The model has several variations, depending on whether the company being analysed is private or has equity capital, is long established or relatively new, and also on the type of business.
Either way, DCF has a number of essential components.
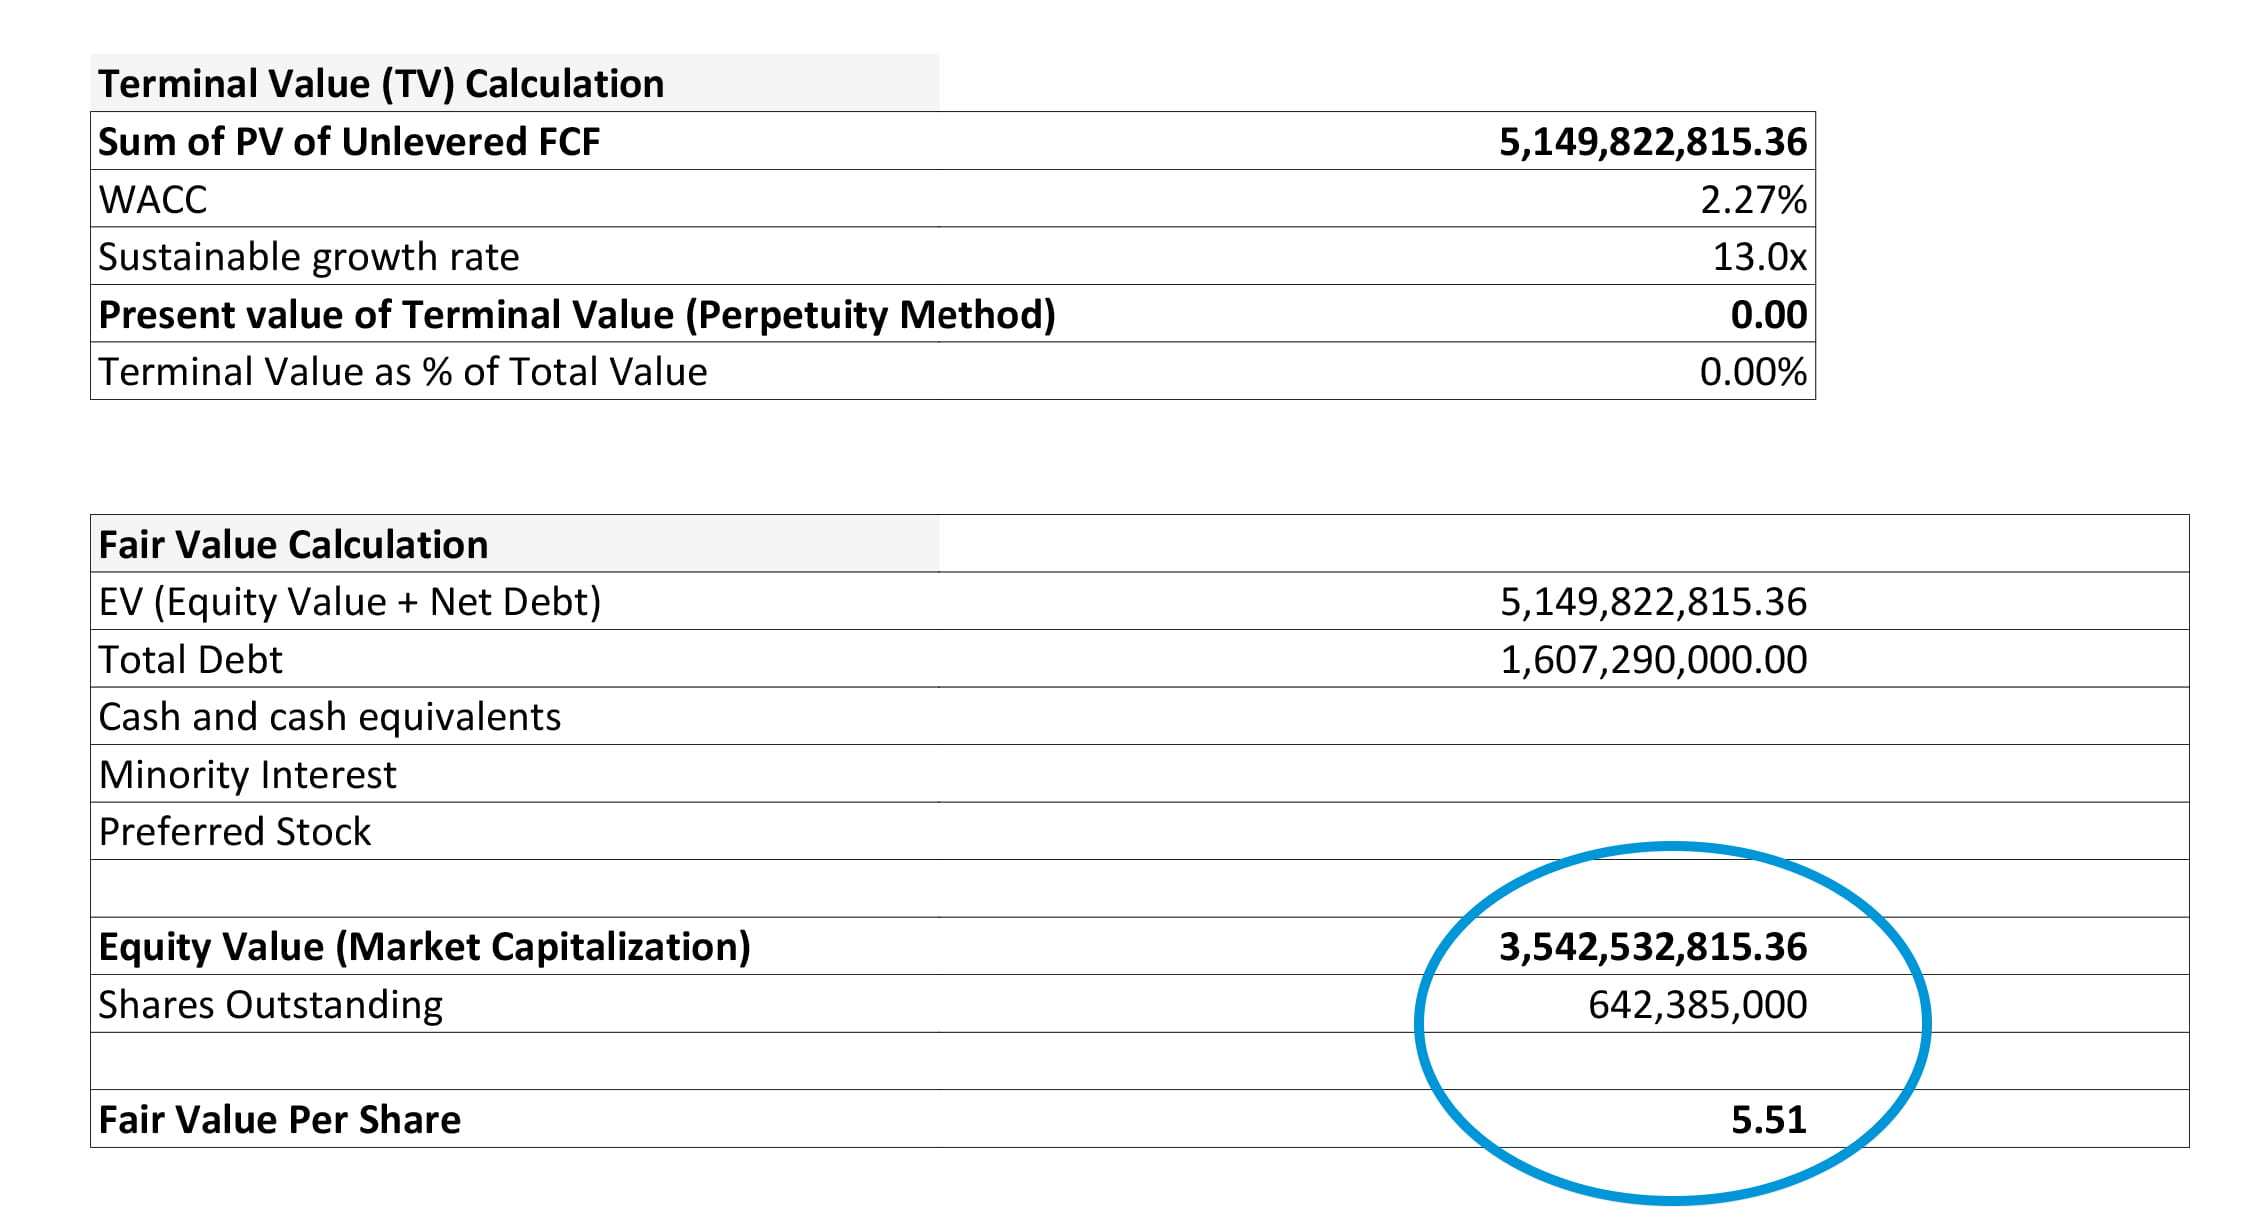
The most striking results of the analysis of Twitter were the persistent negative fair values generated, even under moderately ‘distressed’ scenarios.
Negative fair value per share ranged between minus $10 and about minus $14, highlighting the extent of optimism inherent in the current stock price compared to what we could call reasonably conventional earnings and valuation perspective.
Mainly, this was due to the fact that we used the strictest conditions for the analysis, including just five years of projections, rather than 10 or more.
Less charitably, we could say the extent to which both the market and Twitter itself have deviated from ‘reportable’ financial performance might help account for the disparity between its share price and fair value derived from a stricter assessment of its cash-generating potential.
Given that Twitter’s market value currently sits at $23.5bn with no annual profit in sight, our decision to deploy some of the stricter conditions available from variations of DCF seemed defensible.
On the other hand, our assumption of Twitter’s growth rate in five years could be deemed generous.
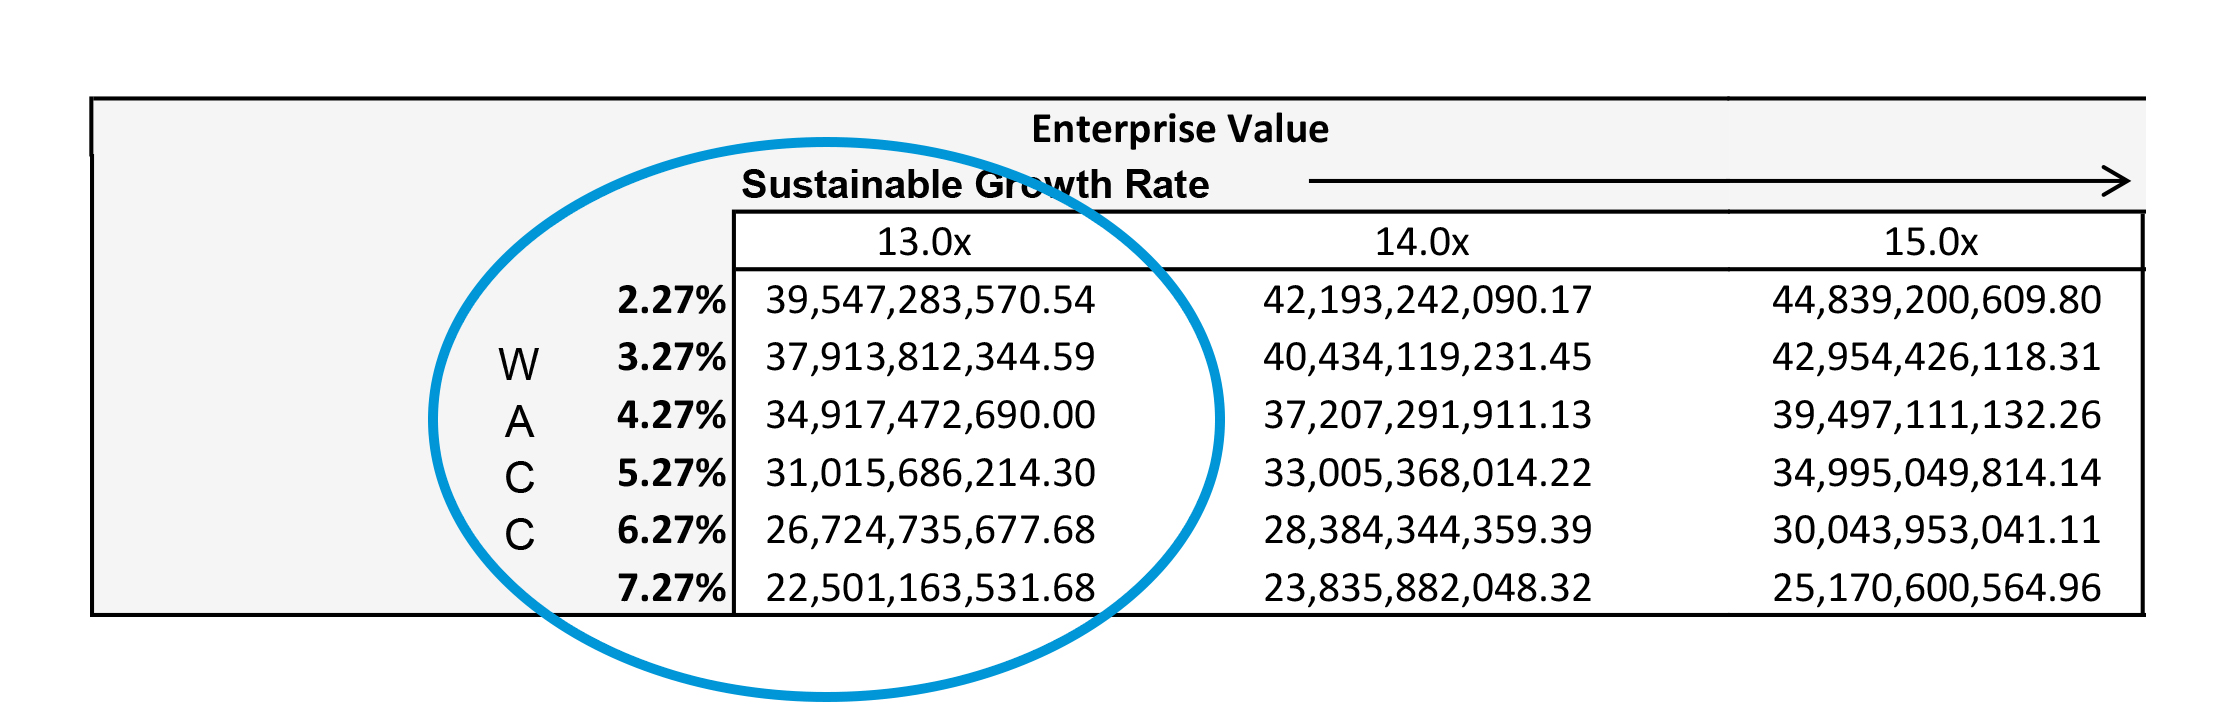
In all probability it’s too generous to assume Twitter’s Enterprise Value (current total equity and total debt) would grow by a multiple of 13 by 2020.
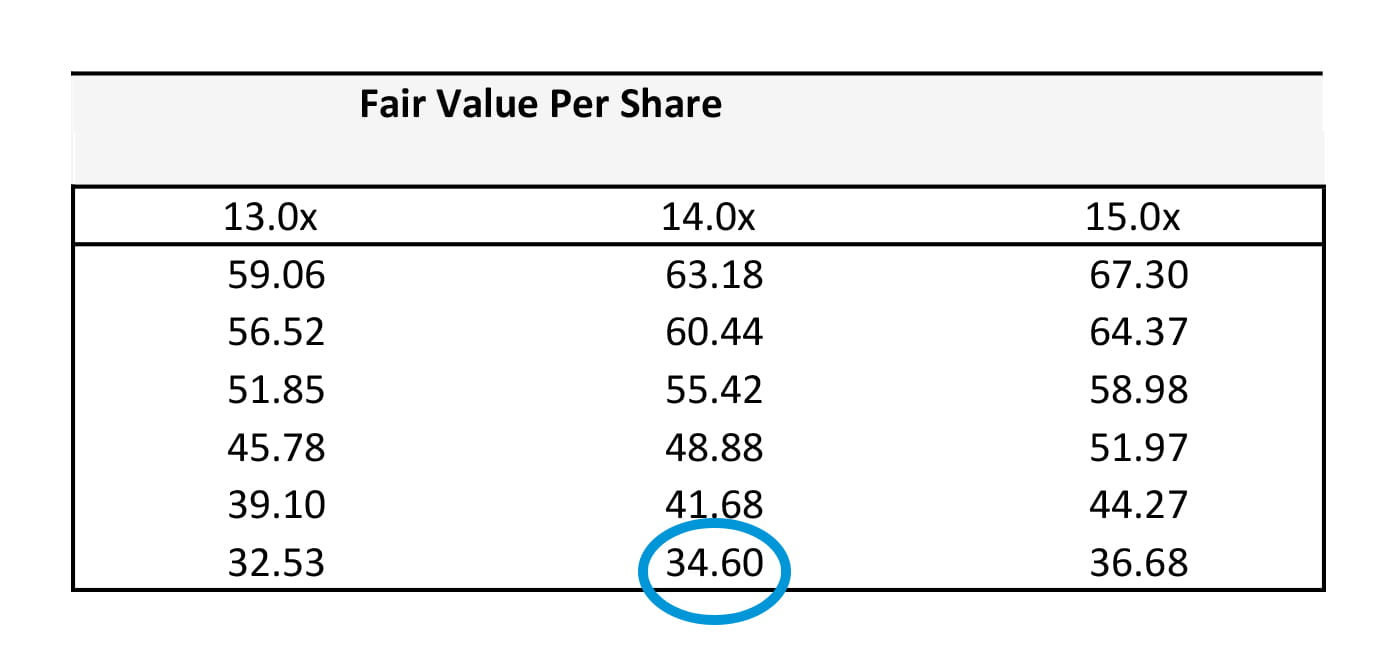
But fair value calculated even on the basis of a 13 times growth multiple of the current enterprise value would bring just $5.53 per share.
Twitter’s current stock price is around $35.
Please click image to enlarge
Furthermore, only under financing costs (WACC) that are at or cheaper than 5.27% does Twitter’s Enterprise Value grow much beyond its current $21.5bn.
Please click image to enlarge
Higher (more realistic) financing costs of 5%-7% weigh on Twitter’s enterprise value or even push it lower.
Twitter’s ‘sustainable growth rate’ would need to have an enterprise value growth multiple of more than 14x to justify its current share price.

Please click image to enlarge
Cautions, qualifiers and provisos
The discounted cash flow is a robust, tried and trusted methodology.
In its current form, its roots can be traced at least as far back as the market crash of 1929.
However, due to the complexity of this form of analysis, it can easily be misused, misunderstood or misinterpreted.
This is a particular risk in our use case – I have simplified calculation, output and, interpretation.
To help overcome these risks I have used conditions that may be overly strict, in terms of financing costs.
I have also used some assumptions which some may consider too generous.
Given all of the above, the results of my DCF can only strictly be said to apply to the highly theoretical scenario represented in this article and not the real world.
A fairer analysis of Twitter might well produce results that are more lenient than the above.
Additionally, there are alternative valuation models that are almost as widely used as discounted cash flow.
The ‘Monte Carlo Method’ springs to mind, but the level of complexity required to compute its analysis correctly was deemed too great for this article.
Conclusion
Despite the undeniably clear potential of Twitter ‘the short-messaging service’, Twitter Inc. has often not lived up to the financial and operational performance targets it has set for itself.
Judged by conventional strict financial standards, we discover a great deal of optimism priced into Twitter’s shares.
Twitter Inc.’s market value could turn out to be overvalued by as much $30, if it were evaluated solely on the value of its current cash-generating potential.
Twitter would need to experience very favourable financial conditions during the next five years to justify a fair value that’s equivalent to its current share price.
Post script:
As you know, Twitter is reporting earnings this evening. The market is looking for $0.04 per share, up from $0.02 per share in Q1. If Twitter can match these earnings then we could see the stock bounce in the short term.
However, we continue to believe that Twitter is overvalued on a fundamental basis, and eventually the market will catch up to this, and we could see a sharp drop in the share price in the years ahead.
