April 25, 2024 03:09 PM

Indices trading
Trade major global indices at City Index like the UK 100, Wall Street and Germany 40. Choose a spread betting or CFD trading account and get tight spreads on European, US, Asian and Australian indices.
-
Sector-specific trading
Speculate on industry-wide trends with sector and thematic indices
-
Range of markets
Access over 40 major global indices with extended trading hours
-
Competitive pricing
Trade indices markets with leading spreads from 2 points on Wall Street
Why trade indices with us?
-

Our promise on price
Take confidence in volatile markets with our fixed pricing and price improver guarantee. -

A globally trusted leader
Trust in our 40 years of experience of accessing financial markets. -

Flexible trading options
Choose the contract type that’s right for you – choose cash or futures across global index markets.
Live pricing
Other types of indices

Thematic indices
Trade themed indices, each based on a basket of equities – including green stocks, remote economy companies, and cannabis shares.

UK sector indices
Trade from a choice of 14 sector indices including energy, banking and mining with City Index.
Latest index news
Latest research

April 25, 2024 03:00 PM
April 24, 2024 03:30 PM
April 18, 2024 04:46 PM
April 17, 2024 11:00 AM
No Tweets were found.
Our performance in numbers
0.1
m+
account holders*
1
.5k+
markets
0.55
s
average execution speed
50
%
of trades successfully executed
*StoneX retail trading live and demo accounts globally in the last 2 years.
Ways to trade indices
City Index offers spread betting and CFD trading on indices. Typically UK traders choose spread betting because any profits are free from UK Capital Gains Tax (CGT)*.
Ways to trade indices
City Index offers spread betting and CFD trading on indices. Typically UK traders choose spread betting because any profits are free from UK Capital Gains Tax (CGT)*.
Best for
Tax-free trading in UK*
Trading in the currency of the underlying market
Trade type
£ per point
CFDs in market base currency
Tax
No UK Capital Gains Tax (CGT)
or Stamp Duty*
No UK Stamp Duty. You do pay UK CGT but losses can be offset against tax*
Markets available
Access 40+ global index markets across cash and futures
Access 40+ global index markets across cash and futures
Costs and charges
Fixed spreads and overnight financing
Fixed spreads and overnight financing
Platforms
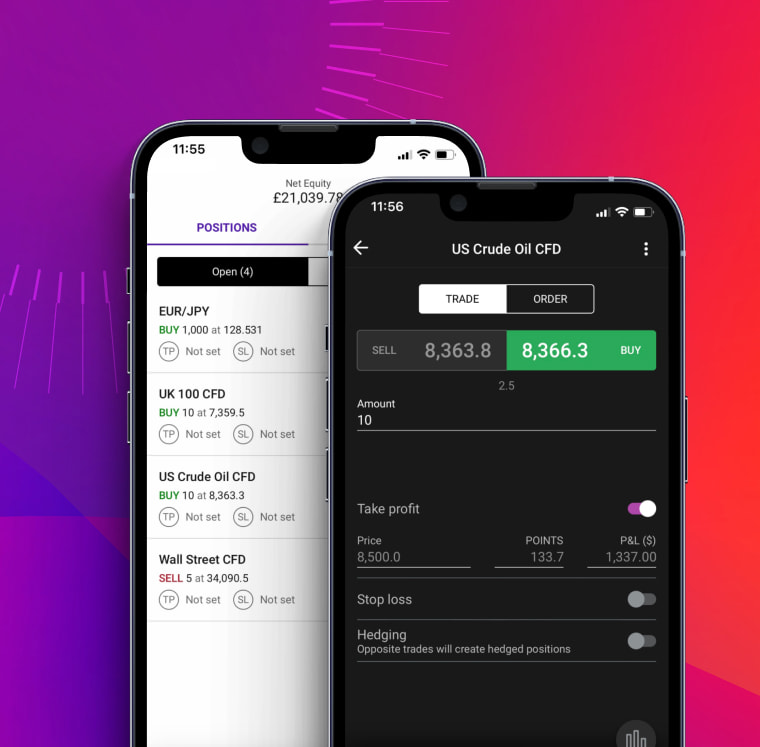
Mobile trading app
Seize trading opportunities with our most easy-to-use mobile app to date, with simple one-swipe dealing, advanced charting, and seamless execution. Available on Android and iOS.
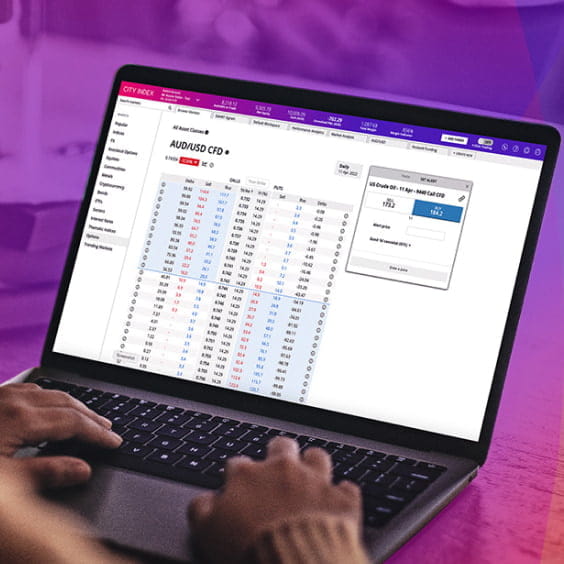
TradingView charts
Complete with one-swipe trading, custom indicators, alerts and drawing tools.
Trading Central
Harness the power of technical analysis and access real-time trade ideas on our most popular markets.
Performance Analytics
Gain deeper insight into your trading and discover how you could improve your performance.


How to trade indices
If you believe that an Index such as the FTSE 100 will rise, you can place a buy trade on City Index’s equivalent market, the UK 100.
If the prices rise, you will make a profit for every point that the index rises. If the market falls, then you will make a loss for every point the index moves against you. Our trading platform tells you in real-time how much profit or loss you are making.
With City Index you can trade indices as a spread bet or CFD. Learn more about how to trade indices.
What are indices?
Indices are popular markets that enable you to diversify your portfolio and gain exposure to multiple stocks at once.
How to trade indices
Learn how to trade global indices, what affects their price movements, and what to look out for on the economic calendar as an index trader.
Indices market hours
Discover the market hours for all the major indices and find out when is the best time to trade them.
Indices FAQ
What is a benchmark index?
A benchmark index is a group of stocks that is used as a measure of the market as a whole. Most of the major indices you’ve heard of are benchmarks: including the S&P 500, Dow Jones and FTSE 100.
Benchmark indices are useful to traders as a way to compare an individual security against the wider market. For example, say that you’ve found a US stock that has grown 20% over the past four years. You might compare that growth to the S&P 500 to see how it fares against 500 of the biggest US stocks.
If the S&P 500 has grown 40% over the past four years, then your stock has actually underperformed the wider market.
Was this answer helpful?
What's the best way to trade indices?
There are multiple ways to trade indices, including via futures, options, spread betting and CFDs. Each has its own benefits and drawbacks, so it’s worth doing your research to decide which works best for you.
Spread betting indices with City Index, for example, is tax free and enables you to trade 40+ major global indices. Trading index options, on the other hand, gives you access to advanced strategies such as straddles and strangles.
You can use your City Index account to trade CFDs or spread bet on indices and index options. Open your trading account now.
Was this answer helpful?
What are indices used for?
Indices are used in a variety of ways by traders. They can give an instant idea of how a country’s economy is performing, can provide a useful way of assessing multiple stocks at once and provide lots of powerful trading opportunities.
At first, stock indices were created for the purpose of evaluating the performance of a stock market. If an index is rising, it means that the stocks it represents are moving up overall, generally a sign that businesses are doing well and economic health is strong. A falling index, on the other hand, is a signal that stocks are struggling, which may hint at deeper problems within an economy.
Stock indices are still used for this purpose today, but they’re also a popular asset class in their own right. It isn’t hard to see why – they enable you to take a position in a basket of the biggest stocks in an economy with a single trade, as well as offering high volatility and liquidity.
Learn more about how indices work.
Was this answer helpful?
If you have more questions visit the FAQ section or start a chat with our support.
Indices explained
What is an index?
An index measures the collective price performance of a group of shares, usually from a particular country. Indices are often used to track and compare the performance of stock markets.
The performance of each index is dictated by the performance of the underlying share prices that make up that index. An index is constructed and calculated independently, sometimes by a bank or by a specialist index provider like the FTSE Group. The choice of the companies included in the index is determined by index calculation rules or by a committee. Not all indices use the same rules, however.
DNA of a stock market index
Price-weighted indices
The index is calculated by adding together the share price of each stock in the index and then divided by the number of stocks in that index. Higher priced stocks exert more influence on the performance of the index. The Dow Jones Industrial Average is an example of a price-weighted index.
Market capitalisation weighted indices
The index is calculated by adding up the market capitalisation of each stock and then dividing by the number of companies. Larger companies with a higher market cap will exert more influence on the performance of the index. The FTSE 100 is an example.
Composite indices
Composite Indices provide a statistical measure of a market or sector’s performance over time. They are useful for measuring an investor’s portfolio performance. They may be price-weighted or market capitalisation weighted. The NASDAQ is an example of a composite index as it measures the performance of an index that is heavily weighted towards technology stocks.
What moves indices?
Indices tend to be affected by broader market movement which affects the price of many companies. Typical examples include:
- Political unrest or uncertainty
- Economic data – e.g. inflation statistics or unemployment numbers
- Changes to interest rates
- Good or bad news affecting several big companies in the same industry– e.g. mining or banking
- The performance of the shares within that index
Benchmark indices
Sometimes you will hear journalists and analysts refer to a market’s benchmark index – this is the index most commonly used to track where a particular market is heading. A few of the main ones include:
- The Dow Jones (Wall Street) – the Dow Jones Industrial Average, the original stock market index, was created by Charles Dow in 1884. It follows the price of the 30 biggest companies on the New York Stock Exchange.
- Standard & Poor’s 500 (US SP 500) – this is the most widely tracked measure of the US stock market. It tracks the prices of the biggest 500 companies listed on the New York Stock Exchange and the NASDAQ.
- FTSE 100 (UK 100) – launched in 1984, the FTSE tracks the prices of the biggest companies by market capitalisation listed on the London Stock Exchange.
- Nikkei 225 (Japan 225) – this is the main stock market index for Japan, tracking the shares of 225 companies listed on the Tokyo Stock Exchange.
- Euro Stoxx 50 (EU Stocks 50) – this index was created to follow the prices of the biggest 50 shares in the Eurozone countries.
- DAX (Germany 40) – founded in 1988, the DAX follows the shares of the largest 40 companies listed on the Frankfurt Stock Exchange.
- CAC (France 40) – tracks the largest 40 companies listed on the Paris bourse.
- ASX (Australia 200) – the benchmark index for the Australian stock market is the ASX 200, which follows the prices of the 200 largest companies listed on the Australian Stock Exchange, ranked by market capitalisation.